LinkedIn Post Engagement: What Your Numbers Really Mean
You keep reopening your LinkedIn analytics, trying to decide whether your latest post worked. The reactions look encouraging, but your follower count barely...
By Ian Kiprono
You keep reopening your LinkedIn analytics, trying to decide whether your latest post worked. The reactions look encouraging, but your follower count barely moves and your newsletter hasn't gained subscribers. You're left choosing between repeating the format, changing the topic, or posting more often, without knowing which decision the numbers support.
That uncertainty makes the next draft harder. You don't just want more activity beneath a post. You want evidence that the right people noticed, understood, and wanted more of your work.
Why Likes Alone Hide What Your Audience Thinks
Say you spend two evenings writing a post. It collects 62 reactions and a few kind comments, but no new followers or newsletter subscribers appear the following week. That's an illustrative scenario, not a measured result, and it captures the problem: visible approval doesn't necessarily mean audience growth.
The disappointment can look like this.

You might copy the post's opening, length, and format because it received the most likes. But if the comments came from people outside your intended audience, you could spend another five weeks reproducing activity rather than attracting readers who want your next article.
LinkedIn post engagement isn't a single verdict. Impressions concern exposure. Comments reveal what people chose to discuss. Saves suggest an intention to return. None of those actions, by itself, establishes that someone subscribed or wants to work with you.
Decision rule: Before choosing your best post, decide what you wanted the reader to do.
For a newsletter writer, the useful question might be whether a post attracted subscribers. For a consultant, it might be whether relevant people started substantive conversations. Those objectives require different evidence.
You need consistent definitions, a calculation that preserves context, and a response log that connects publishing decisions to outcomes. You also need to distinguish personal-profile results from company Page results. Otherwise, even an accurately calculated benchmark can answer the wrong question.
The LinkedIn Metrics That Count and What Each One Means
LinkedIn engagement metrics and what each one signals
| Metric | What It Counts | How It Is Measured | What It Tells You |
|---|---|---|---|
| Impressions | Times the post was displayed, including repeat displays | Total display count, reported as an estimate | Visibility and distribution |
| Members reached | Unique members or Pages that saw the post | Unique viewers, repeat views excluded, reported as an estimate | Approximate audience breadth |
| Reactions | Likes and other reaction types | Count of reaction actions | Quick approval with the lowest effort |
| Comments | Written replies on the post | Count of comments | Conversation and resonance |
| Reposts | Shares to a member's own network | Count of reposts | Content people want to pass on |
| Saves | Posts bookmarked for later | Count of saves | Intent to revisit |
| Sends | Posts shared privately through messages | Count of sends | Personal recommendation |
| Clicks | Clicks on links or content | Included in engagement rate for Pages | Curiosity about the destination |
| Engagement rate | Interactions relative to impressions | Total interactions divided by impressions, expressed as a percentage | Relative response per view |
| Dwell time | How long a member spends viewing the post | Not reported as a standard creator metric | Attention quality |
LinkedIn's post analytics guidance distinguishes impressions from unique members reached, identifies engagement actions, and explains that the Page engagement-rate calculation includes clicks. LinkedIn also cautions that impression and reach figures are estimates, not precise audience counts.
Separate exposure from audience breadth
A person can encounter the same post repeatedly. Those displays contribute to impressions, but repeat views don't expand the unique audience represented by members reached.
That distinction matters when evaluating distribution. More impressions don't necessarily mean proportionately more people discovered you. Record both measures when they're available rather than treating them as interchangeable.
Read actions without inventing motives
The table's interpretations are useful working hypotheses, not proof of someone's intention. A save suggests future usefulness, but it doesn't establish that the reader returned. A send records private sharing, not necessarily an endorsement.
Use the same caution with comments. A detailed disagreement can reveal more engagement with your argument than a friendly compliment, even though both contribute to a comment count.
- Visibility: Label impressions as exposure, not unique readers.
- Breadth: Use members reached for approximate audience size.
- Resonance: Examine what comments say.
- Revisit intent: Treat saves as a signal worth investigating.
Open the analytics for your last five posts and attach a question to each available number. Compare posts only when the metric definitions and observation windows match. Raw likes alone aren't a performance assessment.
Calculating Engagement Rate With a Worked Example
Engagement rate = total interactions ÷ impressions × 100.
For a manual comparison, first define which interactions you're including. Keep that definition unchanged across every post in the comparison.
The following figures are hypothetical calculations, not account results or format benchmarks.
Three illustrative posts with impressions, interactions and engagement rate
| Post | Impressions | Interactions | Engagement rate |
|---|---|---|---|
| Post A, opinion hook | 1,200 | 48 | 4.0% |
| Post B, carousel recap | 9,000 | 135 | 1.5% |
| Post C, short personal story | 800 | 40 | 5.0% |
For Post A, dividing 48 by 1,200 and multiplying by 100 produces 4.0%. The calculation is straightforward. Choosing what to conclude is harder.
Post C has the highest rate but the fewest interactions. Post B has the lowest rate but the most total responses. Ranking these posts by rate alone would put the smallest absolute response first.
A higher engagement rate can describe a smaller response from a smaller pool of impressions.
Watch the denominator
A rate can rise because interactions increased, because impressions decreased, or because both changed. If your objective is discovery, celebrating a higher rate while ignoring narrower distribution could lead you to repeat the wrong approach.
Nor does the rate represent the percentage of unique people who responded. Impressions include repeat displays, and interactions are actions rather than necessarily distinct individuals.
For a Page, preserve the dashboard's inclusion of clicks. For a personal-profile spreadsheet, label your chosen interaction set explicitly rather than assuming that your calculation matches every published benchmark.
Keep these fields together:
- Impressions: The denominator and its observation date.
- Interactions: The total and the actions included.
- Engagement rate: The relative response calculated consistently.
- Outcome: The subscriber, conversation, or other result you wanted.
A broader content performance metrics framework helps keep engagement alongside outcomes rather than above them. Build a five-row spreadsheet for your recent posts before drawing conclusions, and retain both the rate and the absolute response.
Telling Real Response From Passive Activity
Engagement quality starts with relevance, not effort alone. A lengthy comment from someone who'll never need your work may matter less to your objective than a short, specific question from an ideal reader.
A 2025 study of 991 LinkedIn posts associated tags and hashtags with more reactions, and tags with more comments, but those findings don't establish that the people engaging were relevant buyers or peers.
Use this hierarchy to distinguish exposure from useful outcomes.
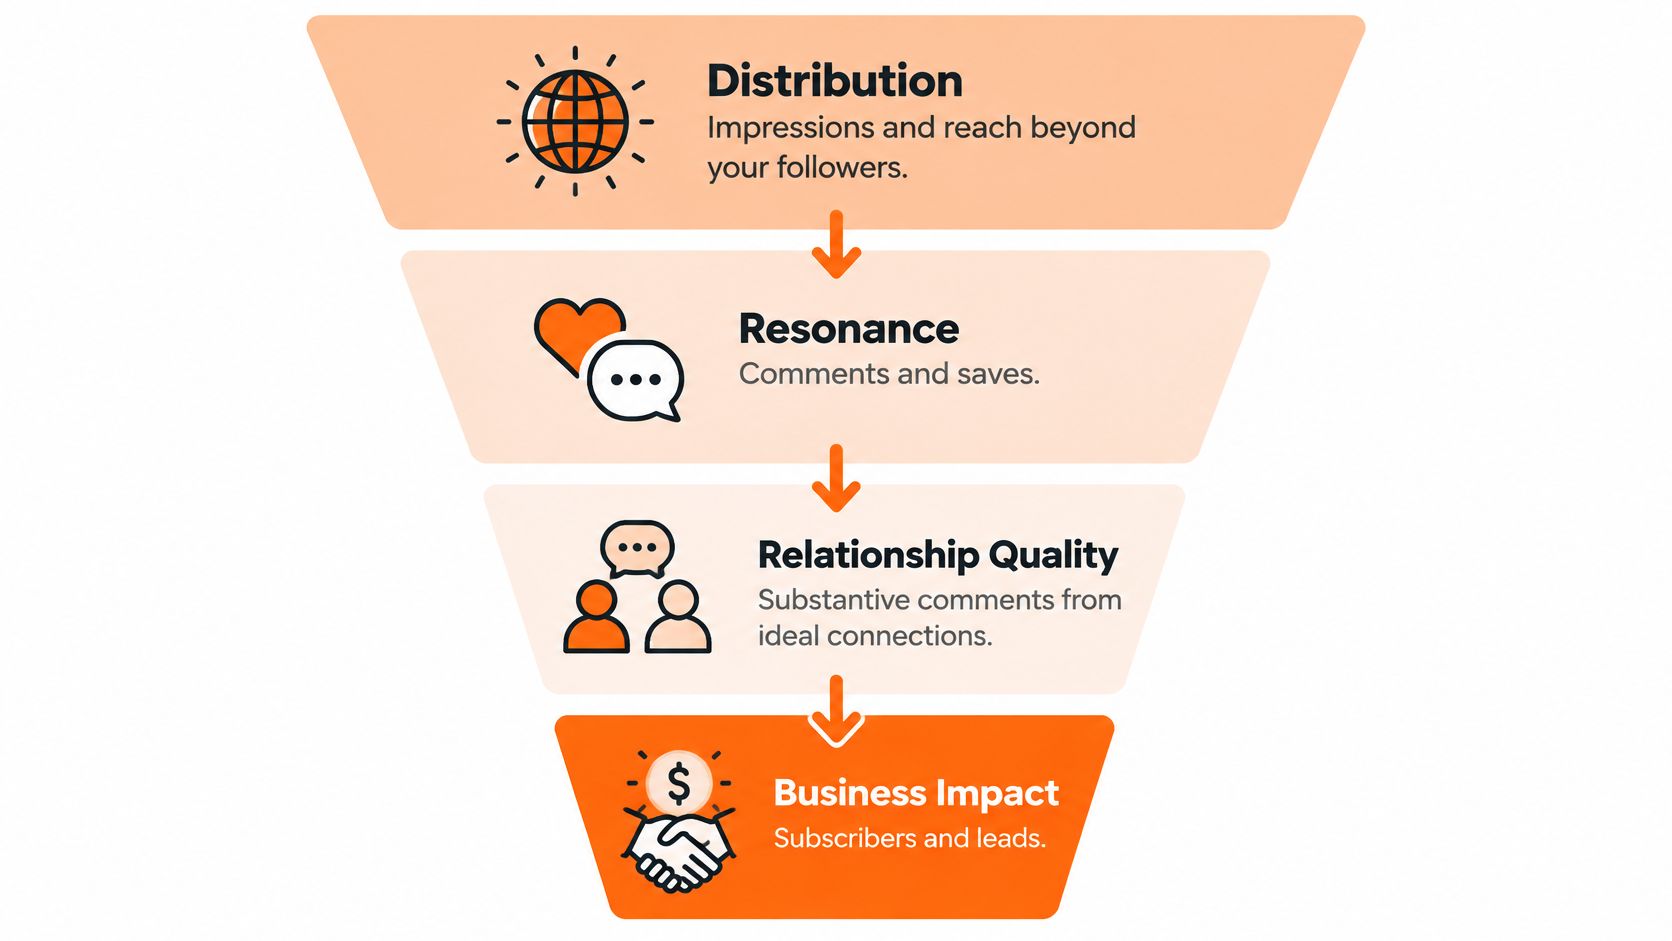
Classify the outcome before comparing posts
- Distribution: Impressions and reach beyond your existing followers, where available.
- Resonance: Comments that address the argument and saves that suggest reference value.
- Relationship quality: Substantive exchanges with people in your field or intended readership.
- Business conversion: Profile visits as an intermediate signal, followed by subscriptions or qualified inbound conversations.
In a hypothetical post with 1,000 impressions, three substantive comments from relevant peers could be more useful than thirty reactions from unrelated accounts. That's a goal-dependent judgment, not a universal exchange rate between comments and likes.
Rank posts by the highest outcome tier they reached, then examine how much evidence supports that classification. Don't let one unexplained subscription automatically outweigh a sustained pattern of relevant conversation.
Account for attention you can't directly inspect
LinkedIn's engineering explanation of dwell time describes viewing time as complementary to explicit interactions and explains that posts predicted to receive extremely short dwell time can be down-ranked. Creators can't read that internal ranking signal directly from ordinary post analytics.
The practical response is to give readers an immediate reason to pause, then reward their attention. Open with the insight, preserve the evidence, and remove introductions that merely announce an article.
For comment review, combine relevance with interpretation. A social media sentiment analysis approach can help distinguish praise, frustration, disagreement, and genuine questions, but sentiment alone doesn't establish commercial intent.
Record off-platform outcomes separately. If someone subscribes after a post, note whether attribution comes from a tracked referral, their own explanation, or timing alone. A subscription after publication isn't automatically a subscription caused by that post.
Diagnosing Posts That Get Likes but No Response
Conflicting numbers are a reason to investigate, not a diagnosis by themselves. Use these patterns to choose a test.
| Pattern | What to investigate | Change to test |
|---|---|---|
| Broad exposure, weak relative response | Whether the opening and audience match the promise | Rewrite the first line |
| Strong rate, small absolute response | Whether relevant people engaged | Test another angle on the same idea |
| Reactions without discussion or saves | Whether readers have anything specific to answer or retain | Add a focused question or useful checklist |
| Substantive comments without downstream action | Whether the next step is clear and relevant | Add an explicit newsletter invitation |
| Suspected rapid scrolling | Whether the opening delays the useful point | Move the core insight upward |
The carousel example produced the most interactions, so calling it a failure because of its lower rate would discard useful evidence. Inspect who responded and what happened next before changing the format.
Likewise, don't diagnose low dwell time from a reaction count. You can inspect whether an opening is vague, but you can't claim that readers barely read it without supporting evidence.
Test discipline: Change one variable, keep a record of the edit, and describe the result as evidence for a hypothesis rather than proof of a cause.
Use content analysis for social media to make those reviews repeatable. Compare openings, promises, supporting details, and next steps, not just totals.
Why Industry Benchmarks Mislead Personal Profiles
The population behind a benchmark determines where it's useful. A company Page finding isn't a personal-profile rule, and an institutional account isn't a substitute for your newsletter audience.
Research findings on LinkedIn engagement and their sample limits
| Source Study | Sample | Finding | Applies To |
|---|---|---|---|
| Buffer posting frequency analysis | More than 2 million posts from over 94,000 accounts | 6–10 posts a week associated with +5,001 impressions per post and +0.76 percentage points in engagement rate; 11+ with +16,946 impressions and +1.40 points | Accounts testing volume; association, not proof of cause |
| Company Page analysis reported by PR Daily | More than 577,000 posts from over 47,000 LinkedIn Pages | Link posts received 4.9% more impressions and 13.5% more interactions | Company Pages, not personal profiles |
| Tag and hashtag study | Random sample of 991 LinkedIn posts | Tags and hashtags associated with more reactions; tags also associated with more comments | Sampled posts; relevance of engagers not established |
| Swiss higher-education social media study | Social media content from higher-education institutions | No measurable effect from publishing time, frequency, or length in that sample; visuals and followership mattered more | Institutional accounts, not individual creators |
The frequency findings justify testing cadence. They don't establish that increasing output alone will improve your results. More prolific accounts may differ in audience size, editorial resources, topic selection, or distribution habits.
The institutional findings don't cancel the frequency analysis either. Different populations can produce different results without either study establishing a universal rule.
Match the comparison before adopting the advice
Before applying a benchmark, check:
- Account type: Personal profile, company Page, or institution.
- Audience context: Follower size, subject matter, and relationship to the publisher.
- Measurement: Included interactions, denominator, and observation window.
- Objective: Exposure, discussion, subscribers, or qualified opportunities.
The Page analysis also makes a blanket prohibition on links difficult to defend. It supplies evidence about links in its population, not a guarantee for your account.
When deciding how many LinkedIn impressions are good, start with your own comparable posts. Use external findings to choose an experiment, then let your account's outcomes determine whether to retain the change.
Build a Response Log and Run a Four-Week Test
Treat this as an experiment you can run, not a promise of growth. Write down your hypothesis before publishing so you don't redefine success around whichever metric improves.
Use this workflow to keep the test focused.
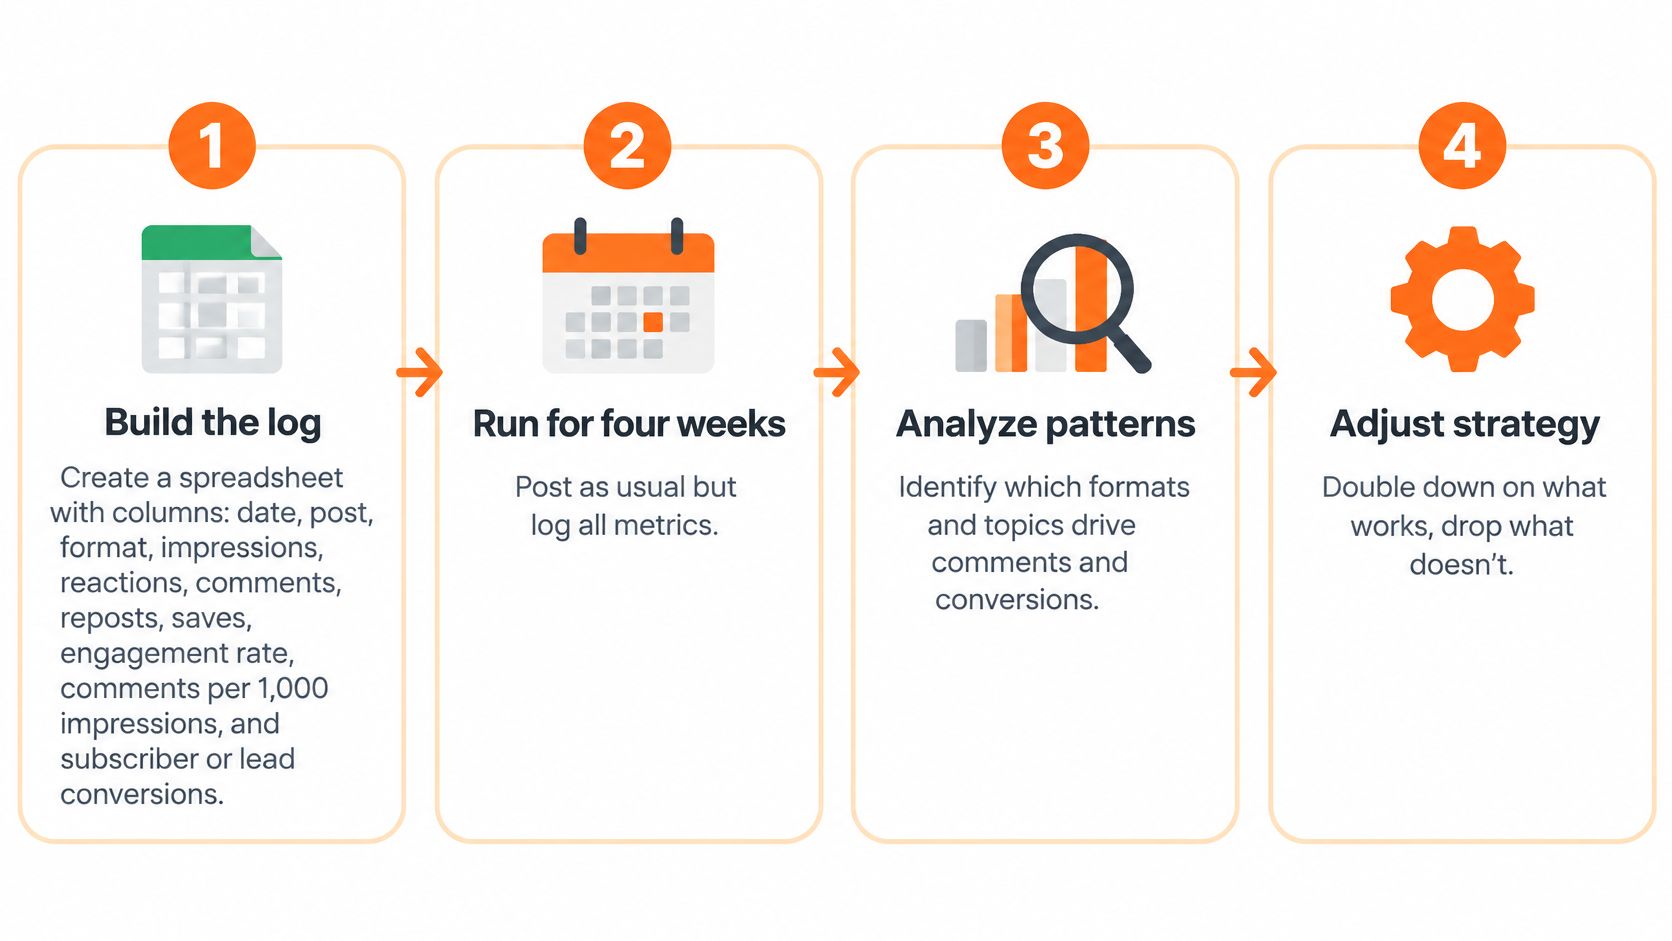
Build the log and establish a baseline
Create a spreadsheet with columns for date, post, format, impressions, reactions, comments, reposts, saves, engagement rate, comments per 1,000 impressions, and subscriber or inbound actions. Add the interaction definition, measurement date, highest outcome tier, and attribution confidence.
Enter your last ten posts. Use a comparable historical four-week period as the baseline, rather than mixing mature posts with newly published ones.
Calculate comments per 1,000 impressions by dividing comments by impressions and multiplying by 1,000. Keep your own replies distinguishable from audience comments where possible.
Run the publishing test
- Choose the idea. Select a proven long-form topic, ideally supported by a strong outcome from the past 90 days.
- Prepare distinct angles. Draft three or four treatments, such as a contrarian argument, personal story, checklist, and evidence-led explanation.
- Keep conditions steady. Publish the angles across a week on your usual account, using consistent time slots.
- Measure consistently. Record each post's results after seven days, including relevant conversations and attributable subscriber actions.
- Repeat cautiously. Use the remaining weeks to test whether the promising angle produces a similar kind of outcome.
A hypothetical result might show Angle B generating 3.1 comments per 1,000 impressions, against a baseline of 1.2, plus two attributable subscribers. That would justify another test ahead of Angle A's sixty reactions without follows, not a claim that Angle B will always win.
For a repeatable review process, use this approach to analyzing content performance and record why you retained or rejected each angle.
Extend the idea into Substack Notes
The Writing Edge's analysis of more than 12.4 million Substack Notes reported that Notes can account for 30%–50% of subscribers for many creators, with some reaching 70%–80%. Those reported proportions aren't a forecast for your publication, but they justify testing Notes as discovery content.
Prepare standalone Notes from the argument, example, and checklist. Don't make every Note an announcement that readers must leave the feed to understand.
Substack's Notes scheduling guide explains the native workflow: open the web composer, select the calendar icon, choose a date and time, and click Schedule; on mobile, use the composer's three-dot menu, with scheduled Notes accessible in Drafts.
For a demonstration of the publishing workflow, use the video below.
In Narrareach, you can draft inside the tool, schedule your Substack post and Notes, and publish the article to Medium, LinkedIn, X Articles, WordPress, and Ghost at the same time. We show followers, subscribers, and who engages, while subscriber attribution connects Notes, posts, articles, and channels to audience movement. Use that connected workflow to reduce manual distribution and identify ideas worth expanding, without treating scheduling itself as a guarantee of faster growth.
If you're ready to connect publishing with measurement, visit Narrareach to draft, schedule, distribute, and track which content brings subscribers rather than merely reactions. If you'd rather start small, keep the response log for four weeks and follow our publishing breakdowns before changing your workflow.