
LinkedIn Engagement Metrics That Actually Matter
You spend two hours writing a LinkedIn post, publish it, and watch the numbers stall. A carefully structured argument gets a few reactions and no discussion...
By Ian Kiprono
You spend two hours writing a LinkedIn post, publish it, and watch the numbers stall. A carefully structured argument gets a few reactions and no discussion, while a coworker's half-formed observation travels far beyond your audience. The dashboard shows impressions, clicks, reactions, and comments, but it doesn't tell you which signal deserves your attention or whether the post failed because of the idea, the format, or distribution.
That's why LinkedIn engagement metrics feel random. The useful question isn't “Did this post get enough likes?” It's “What did this post make people do, and does that behavior justify giving the idea another life on another platform?”
Why Your Numbers Feel Random
I've seen the same pattern repeatedly in post analytics. A polished text post earns modest reach, a few reactions, and no meaningful follow-up. Then a shorter post with a sharper opinion attracts comments, profile activity, or clicks from people who weren't already in the creator's network. The first post may have taken longer to write, but the second one produced stronger evidence that the idea deserved more distribution.
That mismatch creates bad decisions. Creators delete ideas that didn't receive immediate applause, repeat topics that generated easy reactions, or compare their personal profile with a company page as if both accounts reached people in the same way. The dashboard becomes a scoreboard instead of a diagnostic tool.
A better reading starts by separating exposure from response. Impressions tell you that LinkedIn showed the post. Reactions show low-friction approval. Comments indicate a willingness to invest attention in a conversation. Reposts extend the idea into another network. Clicks, saves, profile activity, and follower growth tell you whether the post moved someone beyond passive consumption.
Practical rule: A post hasn't necessarily failed because it has few likes. It may have succeeded if the right people clicked, commented, followed, or continued reading.
The calculation itself also needs consistency. If you're comparing platforms, a guide on engagement rate formulas can help clarify how denominators change the story. LinkedIn's own reporting uses impressions as part of the engagement-rate calculation, so mixing an impression-based result with a follower-based result can make two posts look comparable when they aren't.
I use LinkedIn analytics as a distribution signal. A post with strong comments deserves a deeper article or a discussion-led follow-up. A post with clicks may be better suited to a newsletter or resource. A post with saves can become a reference guide. This approach aligns with the practical distinction between attention and ranking signals described in how algorithms work, where meaningful interaction matters more than just publishing often.
The first useful question is simple: which action did the post earn? Once you answer that, the numbers stop looking random and start telling you what to make next.
The LinkedIn Engagement Metrics Explained
LinkedIn uses several related metrics, and each answers a different question. Views describe how many people saw content, while impressions count how many times a post was shown. LinkedIn says impressions are an estimate, so they're useful for directional comparison, not as a perfectly precise census. The platform also separates impressions from people in your network and those outside it, which helps reveal whether discovery extended beyond existing connections. See LinkedIn's post analytics definitions for the platform's breakdown of impressions, reactions, comments, reposts, saves, sends, profile viewers, and followers gained.
Here's the practical reading:
- Reactions show quick, visible approval. They're useful context, but they require little effort.
- Comments show deeper participation, especially when they address a specific point.
- Reposts indicate that someone considers the idea useful or relevant to their own audience.
- Saves suggest reference value. A saved post may matter even when it attracts little public activity.
- Clicks show that the post moved attention somewhere else, such as a profile, website, newsletter, or document.
- Follower growth connects a single post with longer-term audience interest.
- Engagement rate puts interactions in relation to impressions. LinkedIn says page engagement rate includes clicks, reactions, comments, and shares divided by impressions.
- Profile activity shows whether the post created curiosity about the author.
- Out-of-network impressions indicate discovery beyond the creator's existing audience.
The phrase “good result” needs context. A post can have a high rate with a small audience, while another can create broader discovery with a lower rate. Socialinsider's analysis of 1.3 million LinkedIn business posts found an average engagement rate of 5.20% in 2026, with native document posts at 7.00%. Those figures are useful benchmarks, but they shouldn't replace your own baseline.
| Metric | What LinkedIn Counts | Typical Result | Strong Result |
|---|---|---|---|
| Average engagement rate | Interactions relative to impressions | 5.20% | Above your account baseline |
| Native document engagement | Engagement on document-style posts | 7.00% | Near or above the format benchmark |
| Median engagement rate | Typical post performance in a separate dataset | 2.29% | Around the 90th percentile at 7.65% |
| Median engagements | Typical number of engagements per post | 10 | Consistently above your median |
The table combines different benchmark methodologies, so don't treat the values as interchangeable. ContentIn's study of 100,000 real posts reported a 2.29% median, a 3.62% mean, and a 7.65% 90th-percentile benchmark, illustrating how a small number of exceptional posts can pull averages upward. That's why social media KPIs beyond vanity metrics are useful when you're deciding whether attention turned into a meaningful next action.
I'd track the metric that matches the post's job. For education, saves and comments may matter most. For a newsletter, clicks and follower growth are stronger evidence. For discovery, out-of-network impressions and profile activity deserve priority. A content performance metrics framework can help keep those objectives separate instead of forcing every post into one score.
What LinkedIn Actually Counts as Engagement Now
Public reactions are becoming a less complete picture of performance. Metricool reported that in 2026, likes fell 13%, comments fell 17%, and shares fell 10% year over year, while clicks rose 5% and total engagement increased from 12.21% to 13.90%. The important point isn't that visible engagement has disappeared. It's that a creator who tracks only likes, comments, and shares may miss the actions that show stronger intent.
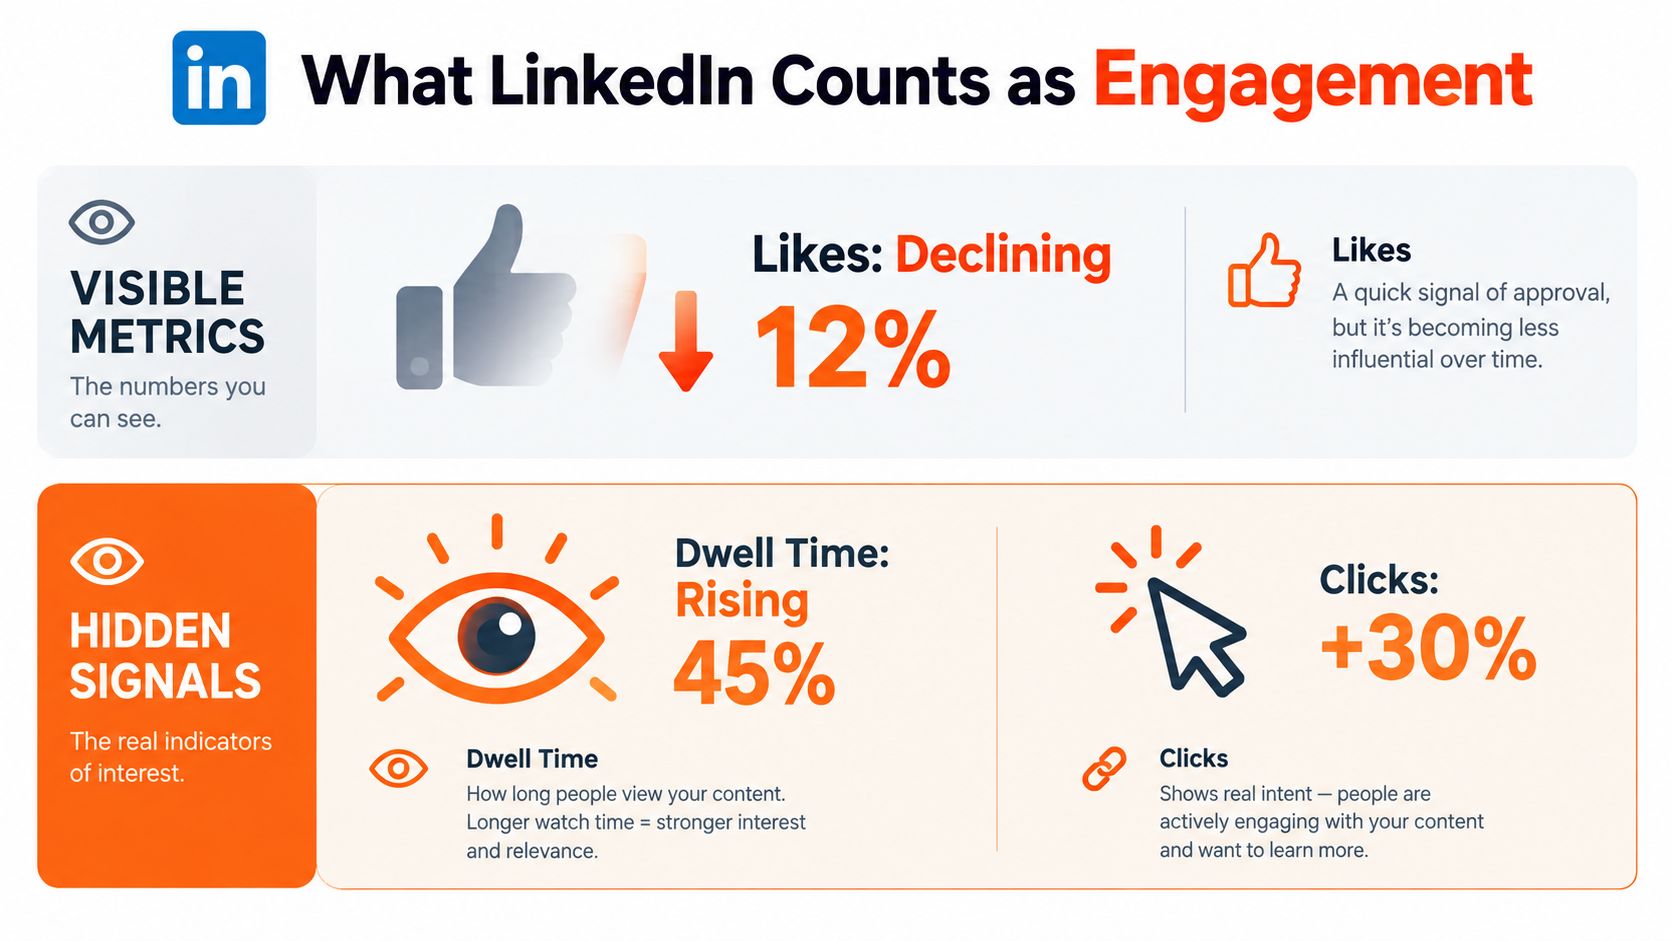
Clicks are visible in analytics, but dwell behavior is less transparent. A reader can stop, expand, scroll through a document, and absorb an idea without leaving a public reaction. That behavior still matters because LinkedIn evaluates engagement quality and relevance when ranking content. The platform's guidance emphasizes meaningful comments, expertise, relevance, and discovery beyond a creator's network.
A post with fewer likes and stronger clicks may therefore be more valuable than a popular post that sends nobody anywhere. The first post can generate newsletter visits, profile views, or a useful follow-up conversation. The second may create social proof without creating a next step.
Track the visible and invisible signals together:
- Reaction volume tells you how quickly people approve.
- Comment quality tells you whether the idea created a conversation.
- Reposts show whether the idea can travel through secondary networks.
- Clicks reveal whether readers accepted your invitation to continue.
- Saves indicate that the content may have lasting practical value.
- Follower growth shows whether the topic earned a future audience.
- Dwell-oriented formats such as documents can indicate that readers spent more time with the idea, even when public reactions were restrained.
The peer-reviewed study linked in the research on LinkedIn engagement behavior distinguishes reactions, comments, and reposts as different behavioral layers. That distinction changes the editorial decision. A reaction-heavy post may need a stronger point of view. A comment-heavy post can become a debate or article. A repost-heavy post may contain a broadly useful framework worth adapting for another audience.
The dashboard won't always reveal why someone paused. You can still infer it by comparing formats, opening lines, click behavior, and the quality of responses. Optimize for the action that supports your objective, not the signal that's easiest to admire.
Personal Profiles vs Company Pages on LinkedIn
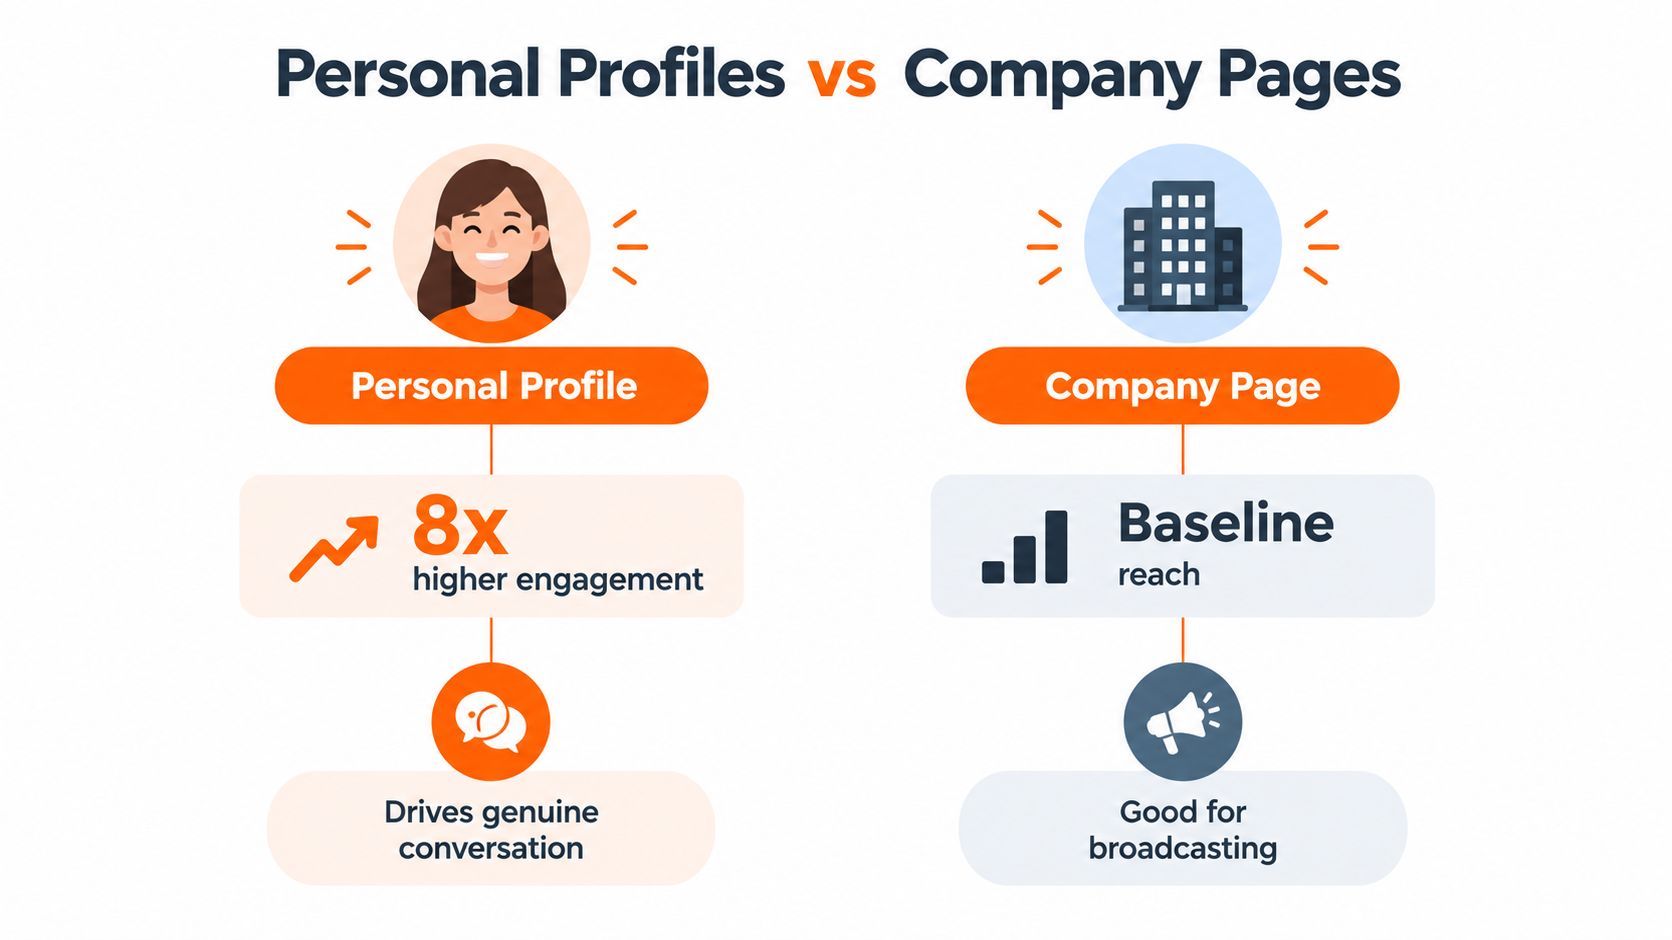
Personal profiles and company pages serve different distribution jobs. A profile carries a person's context, experience, and network. A page communicates on behalf of an organization. Treating their numbers as one benchmark leads teams to make the wrong publishing decision.
Metricool reported that personal profiles generated 63% higher engagement on average, while another 2026 industry benchmark found individual-profile posts received 8x the engagement of identical company-page content. Those figures come from different benchmark sources and should be read as directional evidence of a gap, not as a universal promise for every account.
Give each account a clear role
The company page is useful for official announcements, product information, hiring updates, and a stable record of brand activity. The personal profile is usually better for interpretation, experience, disagreement, and conversation. Readers tend to respond to a person's reasoning differently from a corporate update that has passed through several approval layers.
That doesn't mean the page should disappear. It means the page shouldn't carry the entire distribution burden. A practical split looks like this:
- Personal profiles: Publish the insight, lesson, opinion, or customer-facing explanation.
- Company page: Publish the formal version, supporting asset, or organizational update.
- Team members: Add informed perspectives instead of copying the company caption.
- Content lead: Compare profile and page analytics separately.
Format choice also changes by surface. A document post can explain a process in depth. A personal text post can introduce the experience behind that process. Polls may attract attention from pages with larger audiences, but the question still needs a reason for people to respond rather than a generic request for opinions.
Don't benchmark a founder's post against a page announcement. Compare each account with its own historical performance and objective. If the profile earns conversation while the page provides reliable broadcasting, use both roles rather than forcing them into the same editorial template. Guidance on creating a LinkedIn business page is useful for the setup, but page creation and audience distribution are separate strategic questions.
Reading the Numbers to Drive Distribution
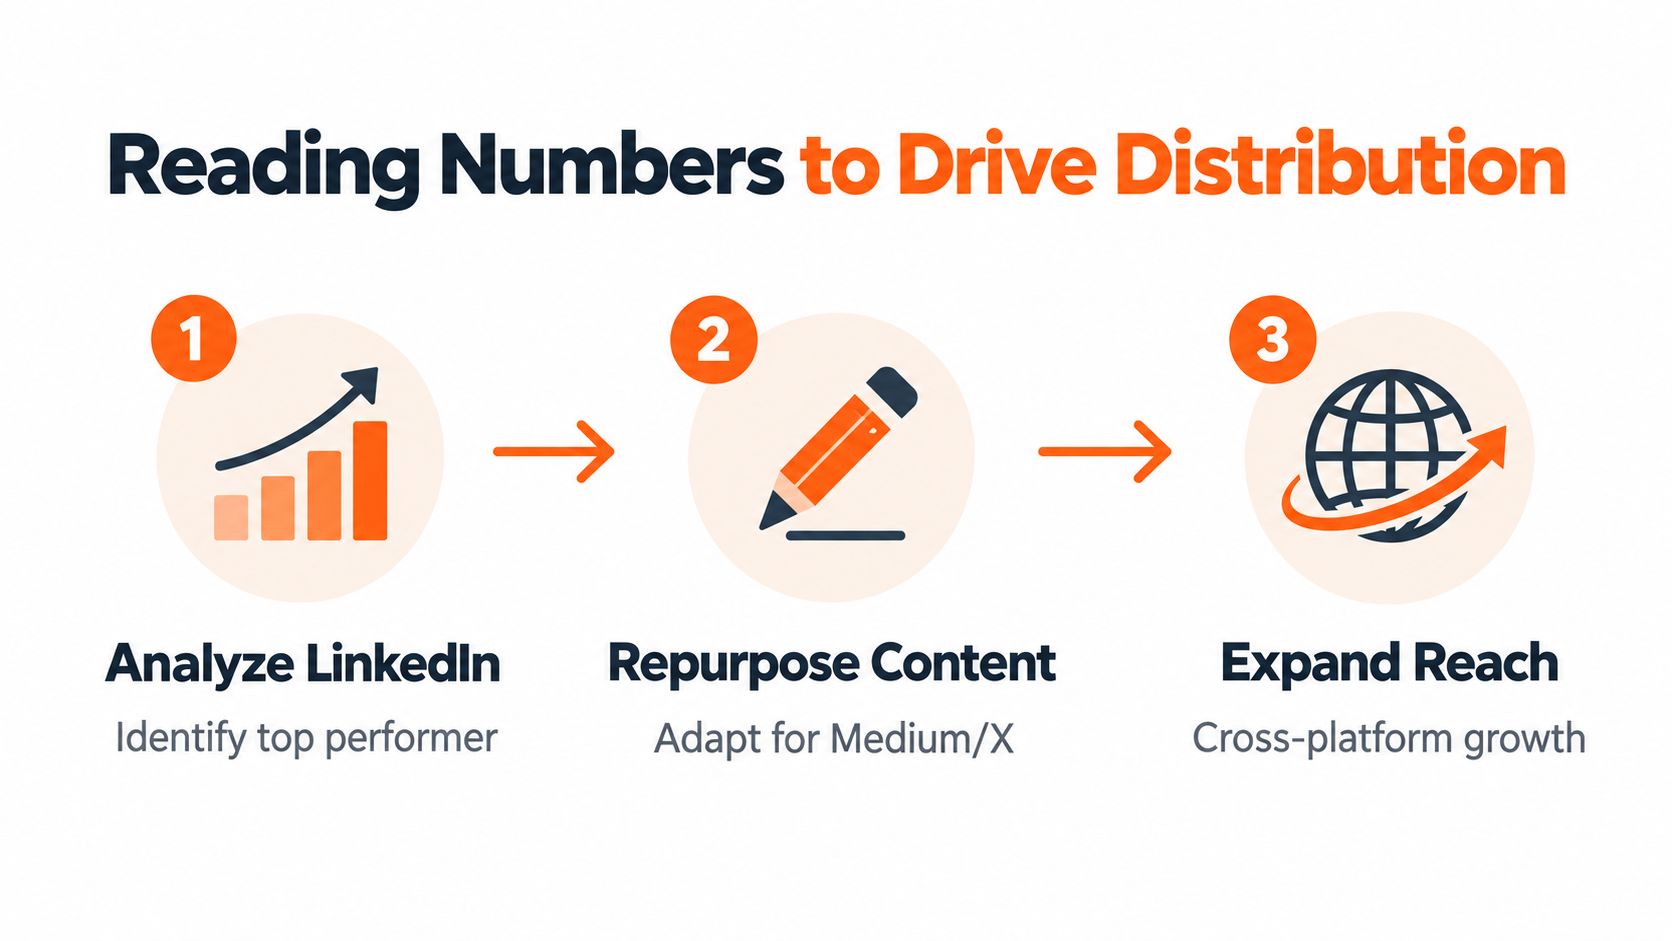
Most creators stop at “the post did well.” That conclusion wastes the most valuable information in the dashboard. A strong post gives you evidence about what to distribute next, where to distribute it, and which format to use.
Start with the metric mix
Review the post after enough time has passed for its initial distribution to settle. Don't make the decision from impressions alone. Write down the strongest action and the audience signal behind it.
- Classify the response. Reaction-heavy, comment-heavy, repost-heavy, save-heavy, or click-heavy posts need different follow-ups.
- Check discovery. Look at in-network and out-of-network impressions. A post that reached beyond your network may contain a transferable idea.
- Inspect profile activity. If the post drove profile viewers or followers gained, the topic may be useful for a broader author-led series.
- Match the next format. Turn a comment-heavy post into a question-led newsletter section. Turn a save-heavy post into a reference document. Turn a click-heavy post into a fuller article.
- Schedule the adaptations. Keep the core argument, but rewrite the opening and structure for each platform.
A LinkedIn post should not be pasted unchanged into Substack Notes, Medium, or X. The audience expects a different reading experience. On Substack Notes, use the sharpest observation and invite a short response. In a Medium article, expand the reasoning and add examples. On X, split the argument into a sequence where each post advances the thought rather than repeating the headline.
Build a week from one proven idea
A useful repurposing sequence might look like this:
- Day one: Publish the original LinkedIn post and observe the engagement mix.
- Day two: Reply to the strongest comment and save the language readers use.
- Day three: Adapt the central lesson into a Substack Note.
- Day four: Expand the argument into a Medium article.
- Day five: Turn the key contrast into an X thread.
- Day six: Publish a LinkedIn document that organizes the lesson visually.
- Day seven: Review clicks, comments, saves, profile activity, and follower growth across platforms.
Scheduling matters because manual copy-paste introduces friction precisely when an idea has momentum. A tool such as Narrareach can schedule Substack Notes, Medium articles, LinkedIn posts, and X content from one dashboard, while supporting cross-platform analytics and content repurposing. The tool doesn't replace editorial judgment. It reduces the administrative work between identifying a winner and distributing its next version.
Use a content analytics dashboard to preserve the connection between the original signal and each adaptation. If the LinkedIn post was click-heavy, judge the next version by downstream visits. If it was comment-heavy, look for meaningful replies rather than trying to recreate the original reaction count.
Common Pitfalls That Distort Your Numbers
The first mistake is celebrating likes as if they were equal to conversation. A 2025 peer-reviewed study operationalized LinkedIn engagement through reactions, comments, and reposts, and found that interpersonal and observance-style posts generated more comments and reactions than business posts. The practical lesson is that engagement type matters. A post with fewer reactions but thoughtful comments or reposts may carry more distribution value than one with quick approval.

The second mistake is comparing account surfaces. Personal profiles and company pages reach different social contexts, so their absolute numbers shouldn't share one benchmark. Compare like with like, then ask whether the audience is relevant.
The third is treating impressions as exact. LinkedIn describes impressions as an estimate, which makes them useful for trend analysis but less reliable for overconfident conclusions about tiny differences. Don't redesign your strategy because one post has a small impression advantage over another.
Avoid these shortcuts:
- Likes as the only success metric: Check comments, reposts, saves, clicks, and profile activity.
- Global averages as your target: Establish a baseline for your own account and format.
- One post as proof: Look for a repeatable pattern across related ideas.
- High reach as business impact: Confirm whether people clicked, followed, or started a relevant conversation.
- Identical cross-posting: Adapt the idea to the reading behavior of each platform.
Your own baseline is usually more actionable than a distant average. Benchmarks help you spot an unusual result, but the metric mix explains what to do next.
Turn One Post Into Distribution Across Every Platform
The most useful LinkedIn engagement metric is the one that changes your publishing queue. If a post earns meaningful comments, don't leave the insight trapped in the comment section. If it generates clicks, develop the destination. If it produces saves, turn the structure into a resource readers can return to.
ContentIn's study of 100,000 real posts reported a 2.29% median engagement rate, a 3.62% mean, a 7.65% 90th-percentile benchmark, and a median of 10 engagements per post. The spread shows why averages can mislead. A small share of high-performing posts can shape overall reach, so your workflow should identify those posts and build on them instead of treating every publication as an isolated experiment.
Use a simple repurposing decision
Choose your top post from the last thirty days, then classify it by its strongest meaningful signal.
- Comments: Write a Substack Note that presents the unresolved question and invites a response.
- Clicks: Build a longer Medium article around the promise that earned the click.
- Reposts: Create an X thread that breaks the transferable idea into sequential points.
- Saves: Produce a LinkedIn document or checklist with clearer structure.
- Follower growth: Start a recurring series around the topic that attracted the new audience.
Schedule the adaptations close enough to preserve momentum, but change the hook for each platform. A Substack Note can be conversational. A Medium article needs a complete argument. An X thread needs progression. LinkedIn can return to the original idea with a new example, counterpoint, or document.
A content repurposing workflow helps you keep those adaptations connected. The goal isn't to publish everywhere for its own sake. It's to give a proven idea several appropriate opportunities to reach people who missed the original.
Review the results by platform and by action. Look for subscribers, meaningful replies, profile activity, clicks, and follower quality. Don't force every channel to produce the same number. Each platform should earn its place by extending the idea toward the audience outcome you care about.
Start today by selecting one LinkedIn post with a clear signal, writing one Substack Note, planning one Medium expansion, and outlining one X thread. Then schedule the sequence instead of relying on memory.
Use Narrareach to schedule LinkedIn posts, Substack Notes, Medium articles, and X content from one dashboard, while tracking the engagement signals that show which ideas deserve more distribution. If you're not ready to schedule, follow the same metric-led workflow manually and subscribe to Narrareach's creator playbooks for more practical experiments on growing an audience across platforms.