
How to Measure Audience Engagement Across Platforms
You publish the same idea on Substack, Medium, LinkedIn, and X, then get four completely different reports back. One dashboard shows opens, another shows...
By Ian Kiprono
You publish the same idea on Substack, Medium, LinkedIn, and X, then get four completely different reports back. One dashboard shows opens, another shows impressions, another emphasizes reads, and a fourth counts likes and reposts. By the end of the week, you've refreshed Substack stats for three days, checked LinkedIn impressions more often than you'd admit, and still can't answer the only question that matters: which version deserves another round?
That confusion isn't a motivation problem. It comes from comparing metrics that use different definitions, denominators, and time windows. I spent a month building a simple cross-platform measurement system for writers, and the most useful change wasn't finding one magical number. It was creating one comparable signal, then using it to decide what to publish, repurpose, and schedule next.
The Guessing Game That Keeps Writers Stuck
On Monday, you publish a Substack essay about a writing workflow. On Tuesday, you turn its strongest argument into a LinkedIn update. On Wednesday, you adapt the same idea into an X thread. You also republish a longer version on Medium because the topic feels substantial enough to travel.
The numbers immediately disagree.
Substack reports how many people opened the email and clicked through. LinkedIn emphasizes impressions and visible interactions. X foregrounds post-level activity and exposure. Medium gives you reading behavior that feels closer to attention than a simple social reaction. None of those numbers is useless, but they don't answer the same question.
I used to respond by checking everything more often. I refreshed email data repeatedly, opened social analytics during writing sessions, and kept a loose note of posts that “seemed” to perform well. That created a record of activity, not understanding. I knew which posts had movement, but not whether the movement came from the right readers or led anyone toward my owned audience.
The practical problem isn't a lack of data. It's a lack of comparable definitions.
The first useful shift is to separate exposure, interaction, attention, and business action. A view tells you someone may have encountered the content. A comment, save, share, or click tells you they did something. A completed read or return visit suggests deeper attention. A subscription or qualified inquiry shows that the attention traveled somewhere valuable.
That distinction also applies outside creator publishing. The guide to client engagement strategies for local businesses is useful because it treats engagement as a set of behaviors rather than a single decorative score. Writers can apply the same discipline to distribution across several platforms.
The system I ended up with had three layers:
- Native metrics, captured in the vocabulary each platform provides.
- Normalized metrics, converted into comparable rates with an explicit denominator.
- Outcome metrics, connected to subscriptions, clicks, replies, and other meaningful actions.
This is also why a deeper method for analyzing content performance starts with the asset and its audience journey, not with whichever dashboard looks most flattering. If you publish on at least two of Substack, Medium, LinkedIn, and X, you don't need more disconnected reports. You need a repeatable way to decide what earns another distribution cycle.
The Engagement Rate Formula and Why the Denominator Matters
After 30 days tracking Substack, Medium, LinkedIn, and X, I kept seeing the same post produce two very different engagement rates. The arithmetic was fine. The denominator was answering a different question each time.
Engagement rate = total interactions ÷ chosen audience base × 100
The difficult choice is the audience base. Followers, reach, impressions, views, and delivered email subscribers can all serve as denominators, but they are not interchangeable. Labeling each one lets you compare like with like instead of making one post appear stronger or weaker through a reporting change.
Here is the worked example I still use when checking a spreadsheet. A post receives 250 likes, 40 comments, and 15 shares, giving it 305 total interactions. With 100,000 impressions, the impression-based rate is:
305 ÷ 100,000 × 100 = 0.305%
Use the same interactions against a 5,000-follower base, and the result becomes:
305 ÷ 5,000 × 100 = 6.1%
Both rates are accurate. The first measures response against recorded exposure. The second measures activity against the account's follower base. Neither should replace the other.
| Base Metric | Calculation | Resulting Rate | When to Use |
|---|---|---|---|
| Impressions | 305 ÷ 100,000 × 100 | 0.305% | When you want to measure response against total exposure |
| Followers | 305 ÷ 5,000 × 100 | 6.1% | When you want a stable account-level comparison |
| Reach | Interactions ÷ unique people reached × 100 | Depends on reach | When unique audience response matters more than repeat exposure |
A small follower base can make a widely distributed post look unusually successful. Impressions can do the opposite when the same people view a post repeatedly. Guidance on engagement metrics warns that impressions may understate engagement intensity in that situation, while reach better represents unique audience response (OmniConvert's engagement metrics guide).
For my four-platform sheet, I kept the denominator visible beside every rate. Followers helped me compare account-level response over time. Reach or impressions showed whether a specific distribution push worked. Clicks per exposed user answered whether attention moved beyond the platform. That labeling became the foundation for one comparable score, because I could only combine platform signals after defining what “exposed” meant for each one.
Substack and LinkedIn will not produce identical-looking rates even when reader response is similar. Email opens come from a delivered audience, while LinkedIn impressions can include repeat feed exposure. I recorded the native numbers first, then compared consistently defined rates rather than forcing every platform into one misleading percentage. The SupaBird growth metric guide offers a useful companion for choosing creator metrics for an operating sheet.
For the wider vocabulary, see this guide to content performance metrics. Keep the denominator beside every score. A percentage without its base is an attractive mystery.
Platform-Specific Signals Worth Tracking
Each platform gives you a different window into the reader's behavior. The mistake is forcing every window to show the same view.
On Substack, watch open rate, click rate, paid conversion, and restack activity as separate signals. Opens tell you whether the subject and relationship earned attention at the inbox level. Clicks reveal whether the headline, introduction, or call to action made the reader continue. Paid conversion is a business outcome, not merely an engagement event. Restacks can show that a reader found the idea useful enough to distribute.
On Medium, read ratio and total reading time give you a stronger sense of completion than claps alone. Claps are visible approval, but a high clap count doesn't tell you whether readers finished the piece. Pair the reaction with reading behavior and the source of the visit.
On LinkedIn, separate impressions from interactions. A post can travel widely without producing meaningful discussion, while a smaller post may attract comments from people who understand the subject and could become subscribers, collaborators, or customers. Comment quality matters more than comment count when your goal is audience fit.
On X, examine replies, reposts, bookmarks where available, profile visits, and clicks. A thread can create conversation without generating a useful next step. For a writer, the question isn't just whether the thread circulated. It's whether the circulation brought readers back to the newsletter, article, or signup page.
The verified benchmark data makes the denominator problem visible. Buffer reported median engagement rates of 6.5% for LinkedIn, 4.86% for TikTok, 4.3% for Instagram, 3.6% for Facebook, and 2.15% for X in its 2026 benchmark analysis (Buffer's social media benchmarks). The same report used data from 52 million Facebook posts across 213,000 accounts for its Facebook benchmarks. Those figures aren't Substack or Medium benchmarks, so they shouldn't be copied into a newsletter report.
| Platform | Key Metric | Weak | Average | Strong |
|---|---|---|---|---|
| Substack | Opens, clicks, paid conversion, restacks | Low attention or little onward action | Consistent opens with some clicks and replies | Opens lead to clicks, subscriptions, and redistribution |
| Medium | Read ratio, reading time, claps | Early exits and shallow reading | Sustained reading with occasional reactions | Strong completion paired with meaningful reactions |
| Engagement rate, comment quality, clicks | Exposure without relevant interaction | Repeated interaction from a mixed audience | Relevant comments, shares, saves, and downstream clicks | |
| X | Replies, reposts, bookmarks, profile visits, clicks | Activity without profile or link movement | Conversation and occasional return visits | Discussion creates qualified visits and repeat distribution |
Socialinsider's 2026 study reported follower-based rates of 3.70% on TikTok, 0.48% on Instagram, 0.15% on Facebook, and 0.12% on X, based on 70 million posts (Socialinsider's social media benchmarks). Those figures illustrate why platform baselines must stay separate. They don't establish a universal threshold for a Substack newsletter or Medium publication.
For writers who want a practical breakdown of LinkedIn signals, this guide to LinkedIn engagement metrics can sit beside your native analytics. The important habit is simple: record what each platform measures before trying to unify it.
Building a Cross-Platform Measurement Layer
UTM parameters are the connective tissue between platforms. They give every shared link a source label, so analytics tools can distinguish a Substack click from a LinkedIn click even when both send readers to the same page.
Start with one naming convention. The example below uses the exact structure:
?utm_medium=institutions&source=substack
For other channels, keep the format consistent and change only the source value:
- Substack:
?utm_medium=institutions&source=substack - Medium:
?utm_medium=institutions&source=medium - LinkedIn:
?utm_medium=institutions&source=linkedin - X:
?utm_medium=institutions&source=x
The parameter names should match the conventions you use in Google Analytics or Plausible. The key is not the particular word “institutions.” The key is that every link follows the same pattern, uses a canonical destination, and preserves the source through the reader journey.
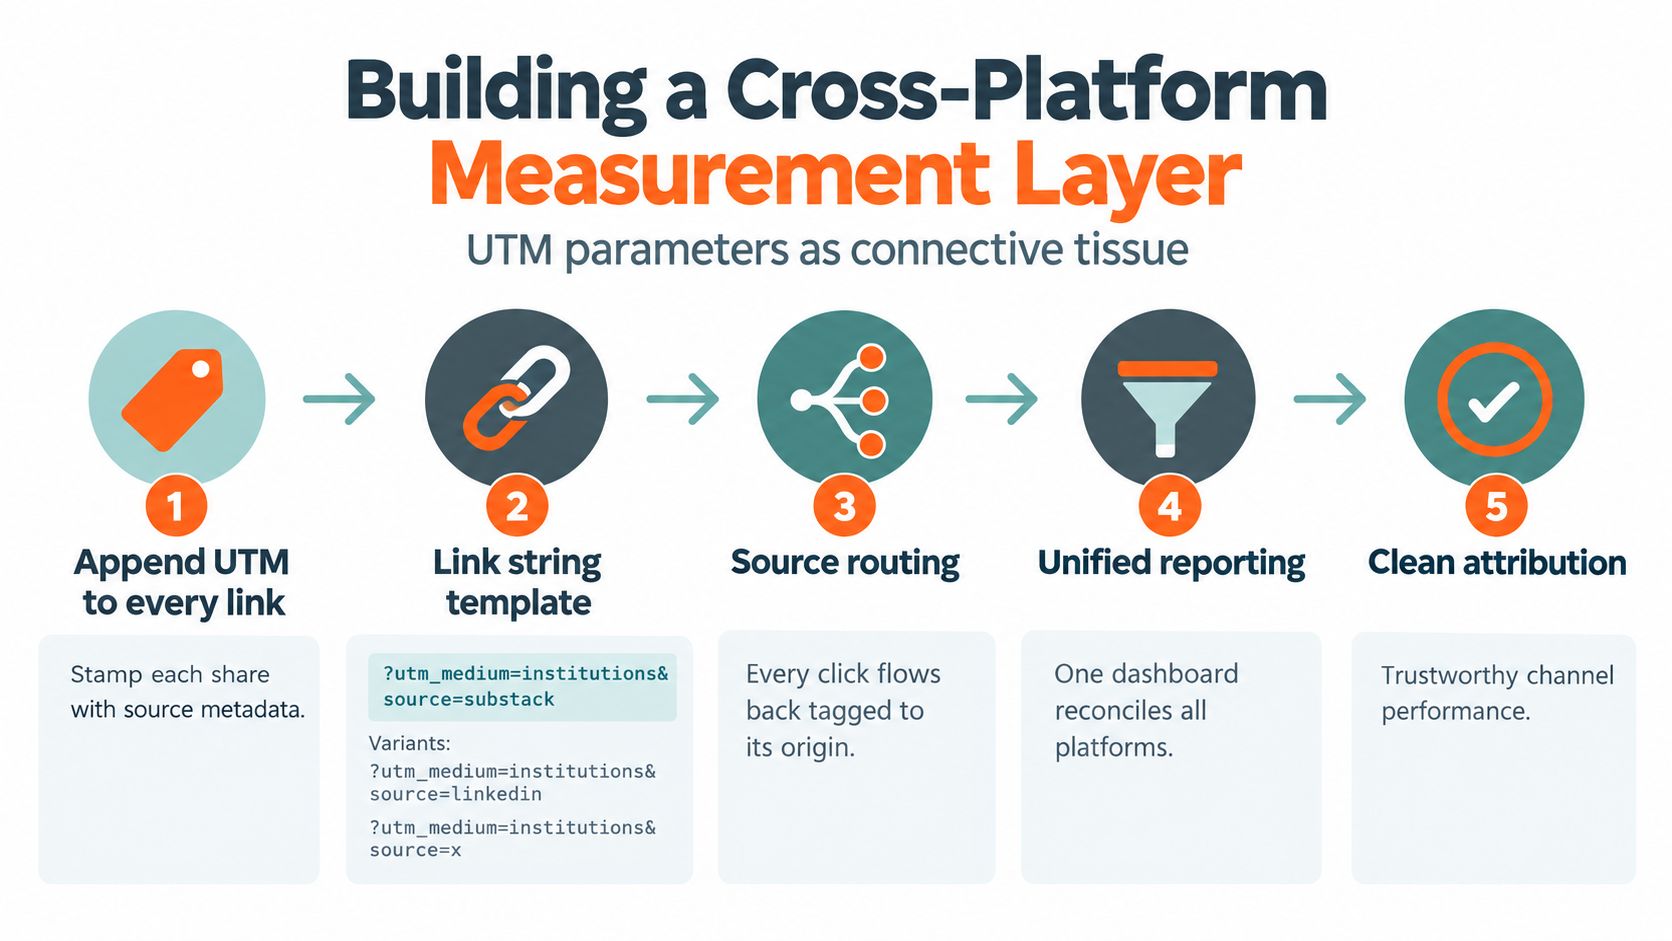
A simple attribution sequence
Suppose your core essay lives on Substack. You send a tagged link in the newsletter, use the same canonical URL in a LinkedIn reshare, and point an X post toward a related Medium version. Each entry has a recognizable source, even if the underlying idea is the same.
In GA4, those labels help you inspect acquisition by source and compare the sessions that followed. In Plausible, the same discipline gives you a cleaner view of referral activity. Neither tool can repair inconsistent naming after the fact, so create the convention before publishing.
The measurement layer should join four kinds of information:
- Asset identity, such as the original essay, a LinkedIn adaptation, or an X thread.
- Channel identity, such as Substack, Medium, LinkedIn, or X.
- Interaction type, such as an open, click, reply, share, save, or completed read.
- Outcome, such as a subscription, paid conversion, inquiry, or return visit.
Normalize only what can be compared accurately. You can compare clicks per exposed user across channels if the exposure definition is clear. You shouldn't treat an email open as equivalent to a feed impression, or a Medium read ratio as equivalent to a social engagement rate.
The cross-platform analytics framework is useful for thinking about the reporting layer as one workflow rather than four isolated dashboards. A system built for newsletter and social distribution can aggregate tagged sources into a shared score, but the score is only trustworthy when the underlying labels and denominators remain visible.
Practical rule: Keep native metrics for diagnosis and normalized metrics for decisions. Don't throw away the original numbers just to create a cleaner report.
Turning Engagement Data Into Distribution Decisions
A dashboard becomes useful when it changes your publishing calendar.
I'd review each asset after its first meaningful distribution window, then ask three questions. Did people respond? Did the response come from the audience I want? Did anyone take the next action? A post that wins only the first question may deserve a rewrite, not a larger push.
A strong Substack post can become a LinkedIn carousel, a Medium article, and an X thread. But repurposing shouldn't mean copying the same paragraph four times. Pull the line that held attention most effectively, then rebuild the format around the behavior each platform supports.
For a long-form page, scroll depth can show where readers stopped. Scroll depth is the percentage of a page a visitor reaches before exiting, and marketing guidance commonly treats 50% for shorter content and about 75% for long-form content of 2,000 words or more as useful reference points (Liquid Web's content engagement metrics guide). Use that information to choose the hook, not merely to congratulate the article for receiving visits.
For social posts, look at which line attracted meaningful replies, saves, shares, or quote reposts. A line that earns a thoughtful response is often a better opening for a LinkedIn post than the line with the most likes. A line that earns repeated reposting may work as the first sentence of an X thread.
| Engagement Tier | Trigger Metrics | LinkedIn Action | Medium Action | X Action |
|---|---|---|---|---|
| Qualified winner | Strong attention plus relevant clicks or subscriptions | Build a carousel or discussion post around the strongest insight | Expand the argument with a clearer introduction and internal links | Create a focused thread using the best-performing hook |
| Attention winner | High reach or opens, but limited onward action | Test a sharper CTA and a more specific audience angle | Tighten the opening and clarify the reader outcome | Reframe the thread around a concrete question |
| Conversation winner | Fewer exposures but deeper replies, saves, or DMs | Respond, extract objections, and publish a follow-up | Add the unanswered question to a revised article | Turn the conversation into a reply-led thread |
| Weak signal | Low attention and little interaction | Pause broad redistribution and test a new angle | Refresh headline, structure, or opening | Don't repeat the same framing without revision |
Scheduling turns those decisions into a system. I'd place a qualified winner into the next available high-attention slot for the channel, then give it a different format rather than reposting it unchanged. A middling performer can return later as a Note, quote card, or short observation after the original framing has had time to cool.
Substack Notes deserve a place in that loop. They let you test a smaller expression of an idea before investing in a full article, while scheduled publishing reduces the chance that useful material remains trapped in a draft folder. Platform guidance also emphasizes scheduled distribution and repurposing for writers who want to publish consistently across formats (Substack's notes and distribution workflow).
The point isn't to publish everywhere every day. It's to let measured response determine which ideas receive another format, another channel, or another scheduled appearance.
Why Engagement Rate Alone Is a Trap
After 30 days tracking Substack, Medium, LinkedIn, and X, I stopped treating the highest engagement rate as the winner. A high rate can still come from the wrong audience.
One X thread pulled hundreds of likes and lively replies, yet sent no measurable traffic to my newsletter. A quieter LinkedIn post drew fewer visible reactions but started a relevant conversation and led to a qualified inquiry. The X post looked better in a platform report. The LinkedIn post created more useful attention.
That split is why I separate surface engagement from audience-fit engagement. Surface engagement includes likes, views, and broad exposure. Audience-fit engagement includes saves, shares, meaningful comments, repeat engagement from the people you want to reach, and actions that continue into an owned channel.
LinkedIn's audience engagement measurement guidance makes a similar distinction, giving more weight to saves, shares, meaningful comments, ideal-customer-profile match, and repeat engagement from the right audience.
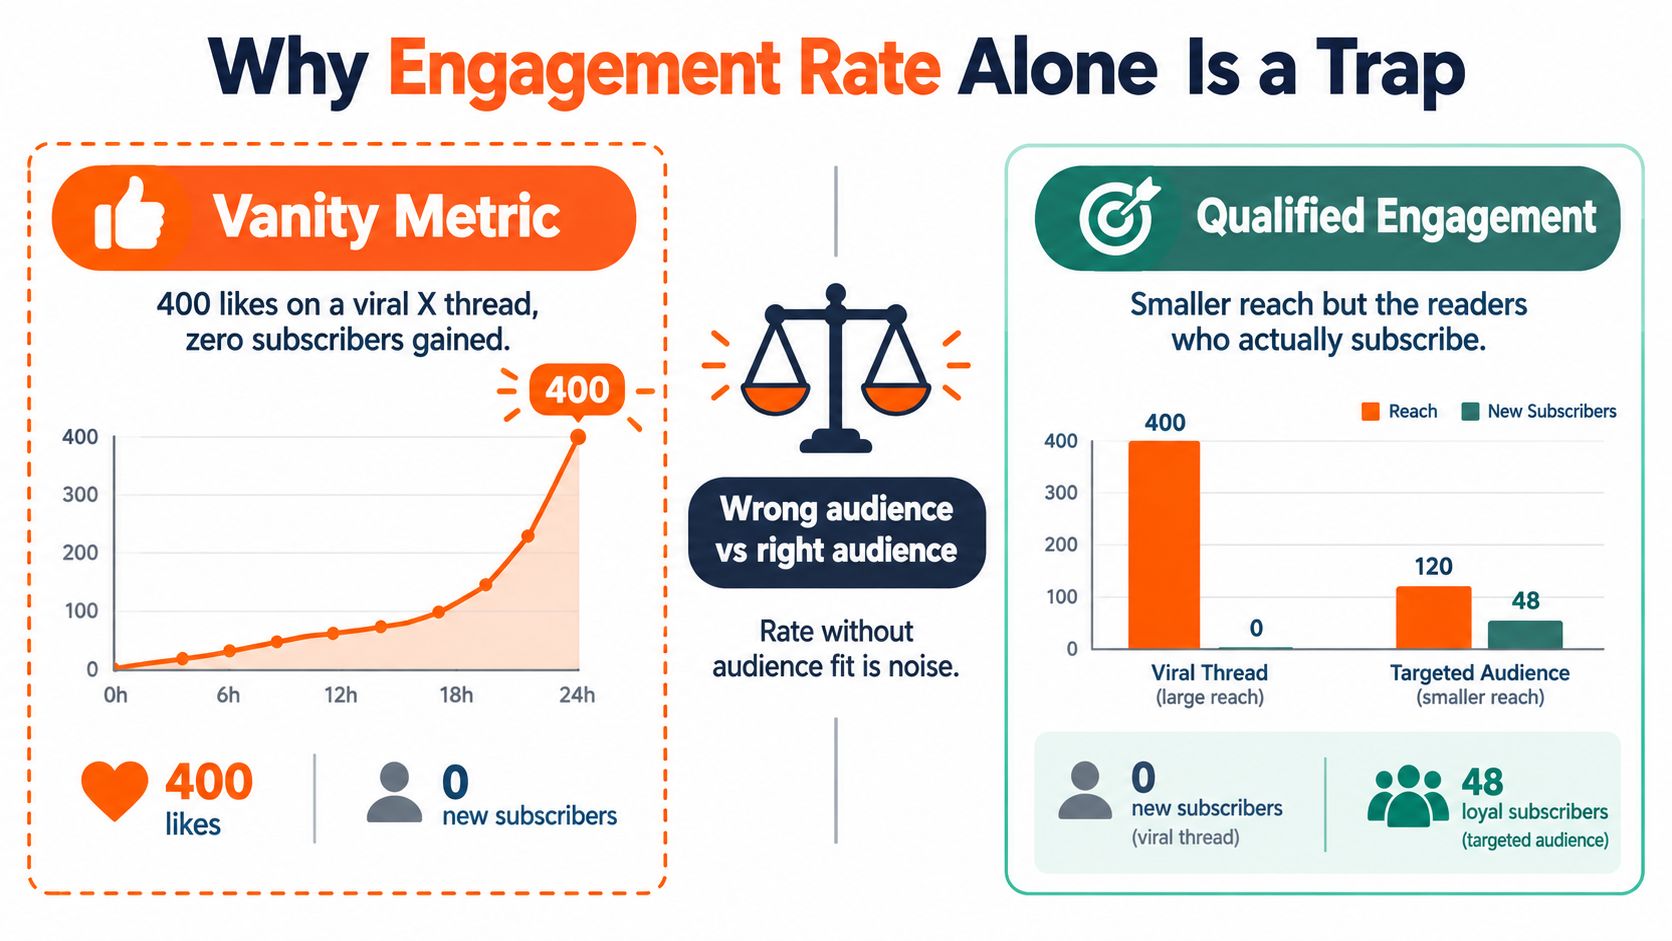
The audience-fit test
For every high-performing asset, I record four details:
- Who interacted: Did the people match my intended reader, buyer, or subscriber?
- What they did: Did they save, share, reply, click, subscribe, or return?
- Where they went next: Did the session continue to an owned page or conversion event?
- What they asked for: Did comments and replies reveal a problem I can address?
GA4 defines engagement rate as the percentage of engaged sessions. That makes it different from a social-media rate, so I translate both into a shared concept, such as engaged sessions per exposed user, before comparing them (Google Analytics Help, engaged sessions). A social interaction can happen without a site visit, while an engaged site session can produce no visible social action.
The same distinction applies to content pages. An on-site GA4 engagement rate of 40% to 70% is cited as a benchmark range, while 25% to 40% 75%-scroll completion is described as a strong target for long-form content in the expert workflow summarized by Umbrex (Umbrex's audience engagement rate framework). I use those figures as context, not universal pass-fail grades.
Across four platforms, a smaller rate from the right people can beat a larger rate from people who will never read, subscribe, or buy. The score that matters is the one that identifies qualified attention and shows what happened after the reaction.
Your 30-Day Measurement Experiment and Next Steps
Treat measurement as a month-long publishing experiment, not a one-time audit. The first week establishes clean labels. The second creates a consistent record of response. The third compares signals across channels. The fourth turns those observations into a distribution loop.
My suggested routine is deliberately small: 10 minutes for tagging, 5 minutes for logging, and 15 minutes for a weekly review. Those are planning allocations, not performance benchmarks. The discipline matters more than the exact duration because an incomplete daily record makes later comparisons unreliable.
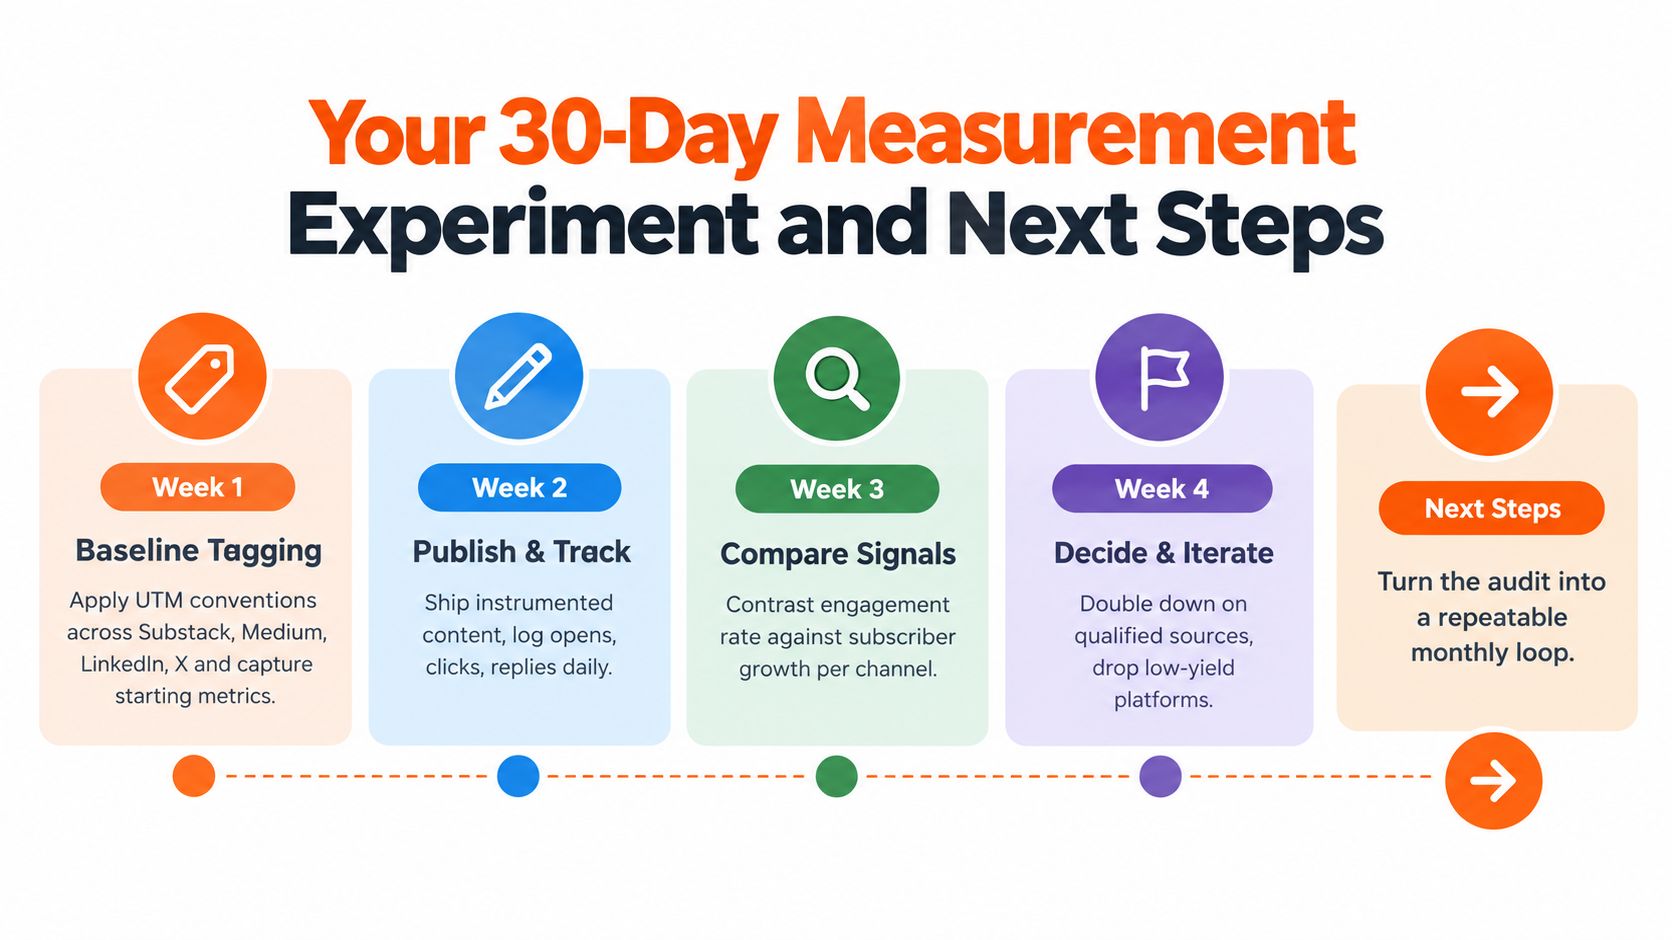
Week 1 and the baseline
Create one row for every asset. Record the canonical URL, platform, publication date, format, UTM source, and intended audience. Capture native metrics without trying to combine them yet.
For Substack, log opens, clicks, replies, restacks, and subscriptions where available. For Medium, log reads, reading behavior, and reactions. For LinkedIn and X, record exposure, interactions, clicks, profile activity, and the quality of responses.
Week 2 and normalization
Choose one denominator for each comparison. If you're comparing account response, use followers consistently. If you're comparing distribution exposure, use reach or impressions consistently. Keep both the raw count and the resulting rate in your sheet.
Add an audience-fit field. A simple editorial score can classify engagement as qualified, possibly relevant, or unqualified based on the reader's relationship to your topic. Don't pretend that this judgment is perfectly objective. Make the criteria explicit so you can apply them consistently.
Week 3 and signal comparison
Look for mismatches. An article with strong reading completion but weak clicks may need a better call to action. A social post with strong comments but no site activity may need a clearer path to the full piece. A newsletter with healthy opens but weak clicks may have earned attention without making the next step compelling.
A separate active-time measure can help with on-site interpretation. Google Analytics 4 treats an engaged session as one lasting 10 seconds or more with a conversion event or at least 2 pageviews, according to industry guidance (Common Ninja's website engagement measurement guide). Don't confuse an open browser tab with active reading.
Week 4 and distribution decisions
Select the ideas that combine attention, audience fit, and onward action. Schedule those for a new format. Refresh the weak ones before redistributing them. Archive the ideas that attract neither useful attention nor a meaningful business signal.
Finish the month by writing four observations:
- Open rate: Which subjects and promises earned inbox attention?
- Comment depth: Which ideas produced specific, thoughtful responses?
- Saves per post: Which insights were valuable enough to keep?
- Reshare conversion: Which shares or reposts led to visits, subscriptions, or other next steps?
The social media analytics reporting workflow can help you turn those observations into a recurring review rather than a forgotten spreadsheet. But even advanced tooling won't compensate for inconsistent tagging or vague definitions. A small, repeatable measurement habit will.
Use Narrareach to connect publishing and performance signals across Substack, Medium, LinkedIn, and X, then schedule Notes, articles, posts, and threads from one workflow instead of reconciling separate dashboards. If you're ready to turn your strongest engagement signals into a repeatable distribution system, visit Narrareach to start free, or keep using the measurement framework above and review your results each week.