
Subscriber Lifetime Value: A Practical Guide for Writers
You can add 40 subscribers over a weekend and still feel your newsletter shrinking. The dashboard shows a healthy list, yet your open rate has drifted from...
By Ian Kiprono
You can add 40 subscribers over a weekend and still feel your newsletter shrinking. The dashboard shows a healthy list, yet your open rate has drifted from 45% to 33% over six months, and nobody seems to upgrade, reply, or share. New names keep arriving while older readers disappear, leaving you with more publishing work but no clearer path to revenue.
That's the uncomfortable gap between list growth and business growth. Every silent unsubscribe represents time, promotion, and possibly an acquisition cost that never had a chance to pay back. Subscriber lifetime value gives you a practical way to see what each reader is worth, how long they stay, and which change this month could improve the economics.
The Subscriber Leak You Can Feel but Cannot See
Monday morning, your email platform reports another spike in sign-ups. The number looks encouraging until you compare it with the behavior underneath. New subscribers open the welcome email, skim one issue, and vanish. Older readers remain technically subscribed but stop clicking. Your list is expanding at the top while value leaks from the middle.
That creates a particularly frustrating operating problem. You may believe you need more promotion, more social posts, or a larger lead magnet, when the constraint is that too few subscribers remain engaged long enough to become valuable. A growing list can hide weak retention for months because the headline count keeps moving upward.
Practical rule: Treat every subscriber as a relationship with a lifespan, not as a permanent line in a dashboard.
The useful question isn't “How many subscribers do I have?” It's “How much revenue or contribution does a typical subscriber generate before they churn?” That shift changes the decisions you make. You can judge whether a paid tier is viable, whether a sponsorship is worth the editorial space, and whether cross-posting is producing readers who stay rather than temporary traffic.
A writer with a smaller but durable audience may have stronger economics than a writer with a much larger list and rapid churn. The difference won't show up in total subscribers alone. It appears in subscriber lifetime value, which turns retention, monetization, and acquisition into one operating metric.
The metric isn't a promise about one individual reader. It's an estimate of the typical contribution across the period subscribers remain active. To use it responsibly, start with a plain definition and a formula you can reproduce in a spreadsheet.
What Subscriber Lifetime Value Actually Means
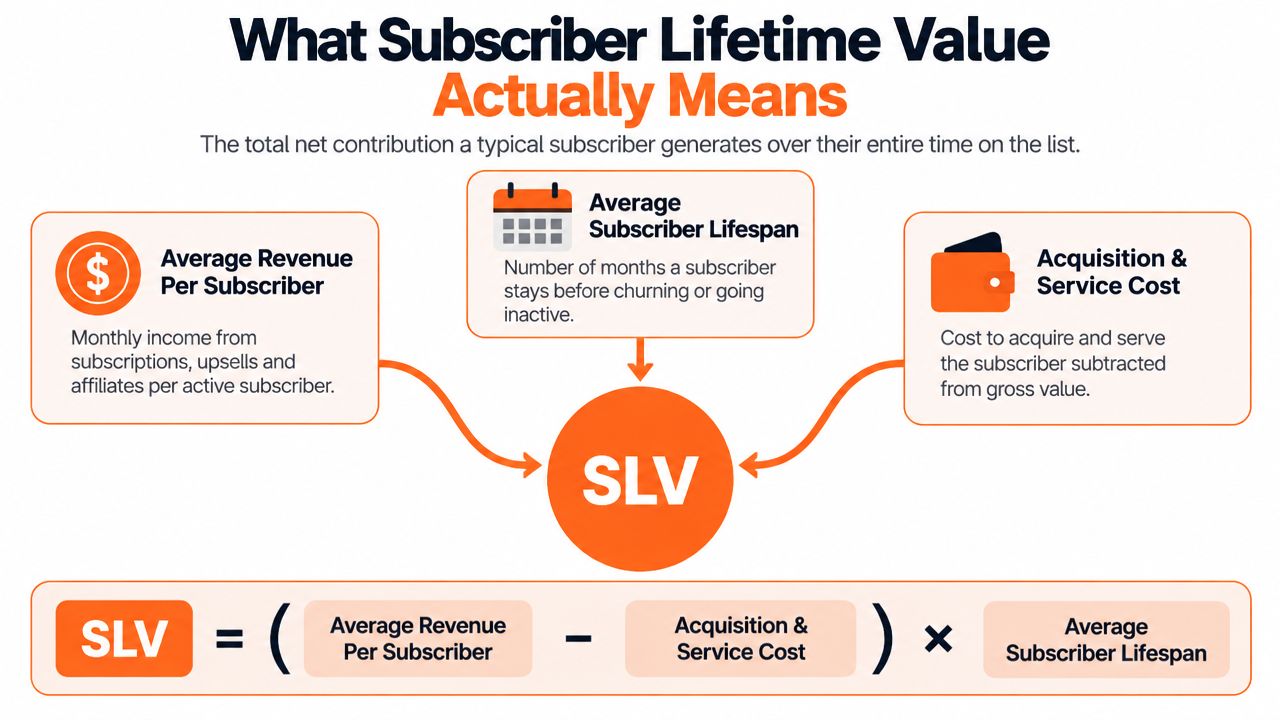
Subscriber lifetime value, or SLV, is the total net contribution a typical subscriber generates during the time they remain active. For a free newsletter, that contribution may come from sponsorships, affiliate revenue, paid products, or referrals. For a paid newsletter, it usually starts with subscription revenue and may include upgrades or additional offers.
The simplest working formula is:
SLV = Revenue per Subscriber × Subscriber Lifespan
Revenue per subscriber, or RPS, is the revenue generated in a period divided by the number of active subscribers in that period. Keep the time unit consistent. If RPS is monthly, subscriber lifespan must also be expressed in months.
A rough lifespan estimate is:
Subscriber Lifespan = 1 ÷ Monthly Churn Rate
If monthly churn is 3%, the rough average lifespan is about 33 months. At 5% monthly churn, it falls to about 20 months, a difference that can materially change lifetime value. This recurring-revenue framework is outlined by Boston Consulting Group's subscription economics analysis.
The paid-tier version
Once you have a paid tier, use the ARPA variant:
SLV ≈ ARPA × Gross Margin ÷ Churn Rate
ARPA means Average Revenue Per Account. For a newsletter, that may be the average monthly subscription revenue per paying account after accounting for the fact that some readers are on different plans. Gross margin matters because gross subscription revenue isn't the same as money available after payment processing, refunds, platform fees, and service costs.
Subscriber lifetime value also differs from a total subscriber count or an open rate. Subscriber count measures audience size. Open rate measures one type of engagement. SLV combines revenue and retention, so it belongs beside those metrics rather than replacing them. For a wider view of how audience metrics fit together, see this guide to content marketing metrics.
Use CAC as a guardrail
A widely used benchmark is a 3:1 CLV-to-CAC ratio, meaning a customer should generate at least three dollars of lifetime profit for every dollar spent acquiring them. Anything below 1:1 is generally unsustainable, as the same BCG analysis explains.
For a writer, the practical interpretation is straightforward. If your subscriber generates $30 of lifetime gross profit, your acquisition cost should stay around $10 or less to preserve that ratio. This isn't a universal law, but it gives you a disciplined ceiling for paid ads, referral rewards, and promotional partnerships.
Two Worked Examples for Independent Writers
The fastest way to make SLV useful is to run the calculation on a list that resembles yours. These examples use gross revenue first, then show where margin and refunds belong.
Example one, a free newsletter
Suppose a free newsletter has 5,000 subscribers and earns $0.40 per active subscriber per month from one sponsor. Monthly churn is 4%.
The calculation is:
- Revenue per subscriber: $0.40 per month
- Subscriber lifespan: 1 ÷ 0.04 = 25 months
- Subscriber lifetime value: $0.40 × 25 = $10
- Approximate CAC ceiling: $10 ÷ 3 = about $3.33
The $10 figure is a gross estimate. Subtract sales time, ad operations, platform fees, refunds, and other attributable costs before using it to authorize acquisition spending. If sponsorship income varies heavily by issue, use a longer revenue window rather than one unusually strong send.
Example two, a paid newsletter
Now consider a paid newsletter with 1,200 subscribers charging $7 per month. Monthly churn is 2.5%.
Using the simplified ARPA formula:
- ARPA: $7 per month
- Subscriber lifespan: 1 ÷ 0.025 = 40 months
- Lifetime gross figure: $7 × 40 = $280
- Approximate CAC cap at 3:1: $280 ÷ 3 = about $93
That $280 is not net profit. Payment processing, platform fees, refunds, discounts, and support reduce the amount available to fund growth. Annual plans may also change the timing of cash collection and the retention pattern, so compare cohorts rather than assuming every subscriber behaves like the average.
| Input | Free Newsletter, 5k subs | Paid Newsletter, 1.2k subs |
|---|---|---|
| Monthly revenue per subscriber | $0.40 | $7 |
| Monthly churn | 4% | 2.5% |
| Estimated lifespan | 25 months | 40 months |
| Gross SLV | $10 | $280 |
| Approximate 3:1 CAC ceiling | About $3.33 | About $93 |
These examples also show why creator monetization strategies need to be evaluated through both revenue and retention. A higher price can raise ARPA, but it won't automatically raise SLV if the offer causes readers to cancel quickly.
2026 Benchmarks by Niche and Channel
Benchmarks are useful for calibration, not self-judgment. Subscriber value varies by topic, audience intent, pricing, distribution channel, and the mix of free and paid readers. Recent paid-newsletter data places median subscriber LTV between $83 in Community and $230 in Investing, according to Beehiiv's 2026 paid-newsletter benchmark report.
That spread matters. A reader who subscribes for investment analysis may have a different willingness to pay from someone joining a broad community newsletter. Don't use a category median as a target until you've compared it with your own price, churn, and product depth.
The same caution applies to channel behavior. Subscription-commerce research reports that app users often generate 2.8x to 5x higher LTV than web-only shoppers, while omnichannel users can produce about 30% higher LTV than single-channel users. The broader lesson for newsletter operators is that repeated, convenient points of engagement can strengthen value, but you should measure your own reader journey rather than import an ecommerce multiplier. The findings are summarized in subscription-commerce benchmark research.
Reverse-engineer your own range
Take your current ARPA and divide it by churn to create a rough gross LTV. For instance, $8 ARPA with 4% monthly churn implies roughly $200 before margin and costs. That calculation is a diagnostic. If your revenue is healthy but SLV trails your expectations, churn is probably the first variable to investigate.
Don't manufacture precision around niche bands that aren't supported by your data. Compare free and paid cohorts separately, then split by acquisition source where possible. A subscriber discovered through a Substack recommendation may behave differently from one who arrives through an X thread or a paid placement.
Substack can help discovery through its built-in network. A standalone email service provider can give you more control over the owned relationship and automation. Neither channel guarantees higher value. The useful comparison is cohort retention and net revenue by source, which you can review with a Substack subscriber analytics workflow.
Tracking SLV With the Analytics You Already Have
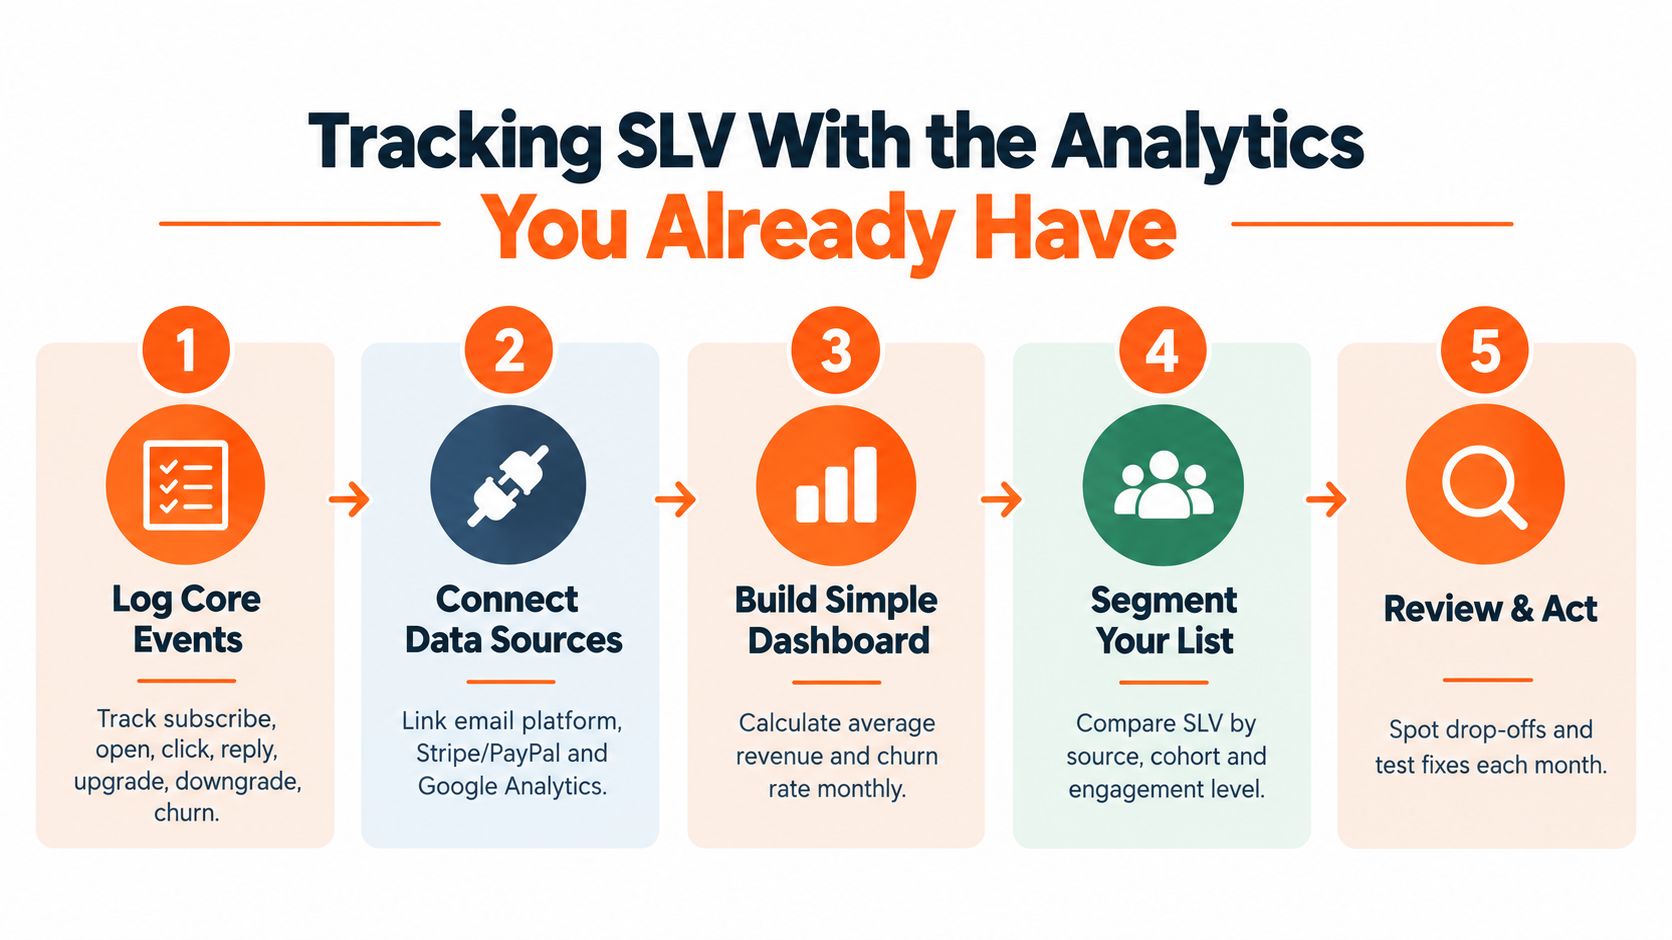
You don't need an enterprise data warehouse to start. You need consistent event names and a record of when subscribers join, engage, pay, and leave.
Log these events:
- Subscribe: Date, source, free or paid status, and landing page.
- Engage: Opens, clicks, replies, and meaningful actions.
- Upgrade or downgrade: Plan change, price, and date.
- Churn: Unsubscribe, payment failure, or confirmed inactivity.
- Resurrection: A returning subscriber who reactivates or pays again.
Substack's Stats panel can supply newsletter activity and subscriber movement. Beehiiv offers subscriber-level reporting. Stripe or Memberful can provide paid billing events. A spreadsheet can hold the join-to-churn timeline when your tools don't connect cleanly.
Build a cohort view
Group subscribers by signup month. For each cohort, record how many remain active after 30, 90, and 180 days, then compare revenue generated by that group with the acquisition source. A simple heat map makes weak onboarding visible because a cohort that drops sharply early will look different from one that retains steadily.
Calculate weighted monthly churn from the cohort table instead of trusting a single-month snapshot. Weight each cohort by its active subscriber count or revenue contribution, and document the method so you use the same basis every month.
Your monthly ritual can take about 20 minutes:
- Export the latest subscriber and revenue data.
- Update cohort retention, churn, and RPS.
- Recalculate SLV using the same formula.
- Write one sentence describing what changed and why.
- Choose one test for the next cycle.
A content analytics dashboard can help organize cross-platform signals, but a clean spreadsheet is enough to establish the habit.
Three Levers That Move Subscriber Lifetime Value
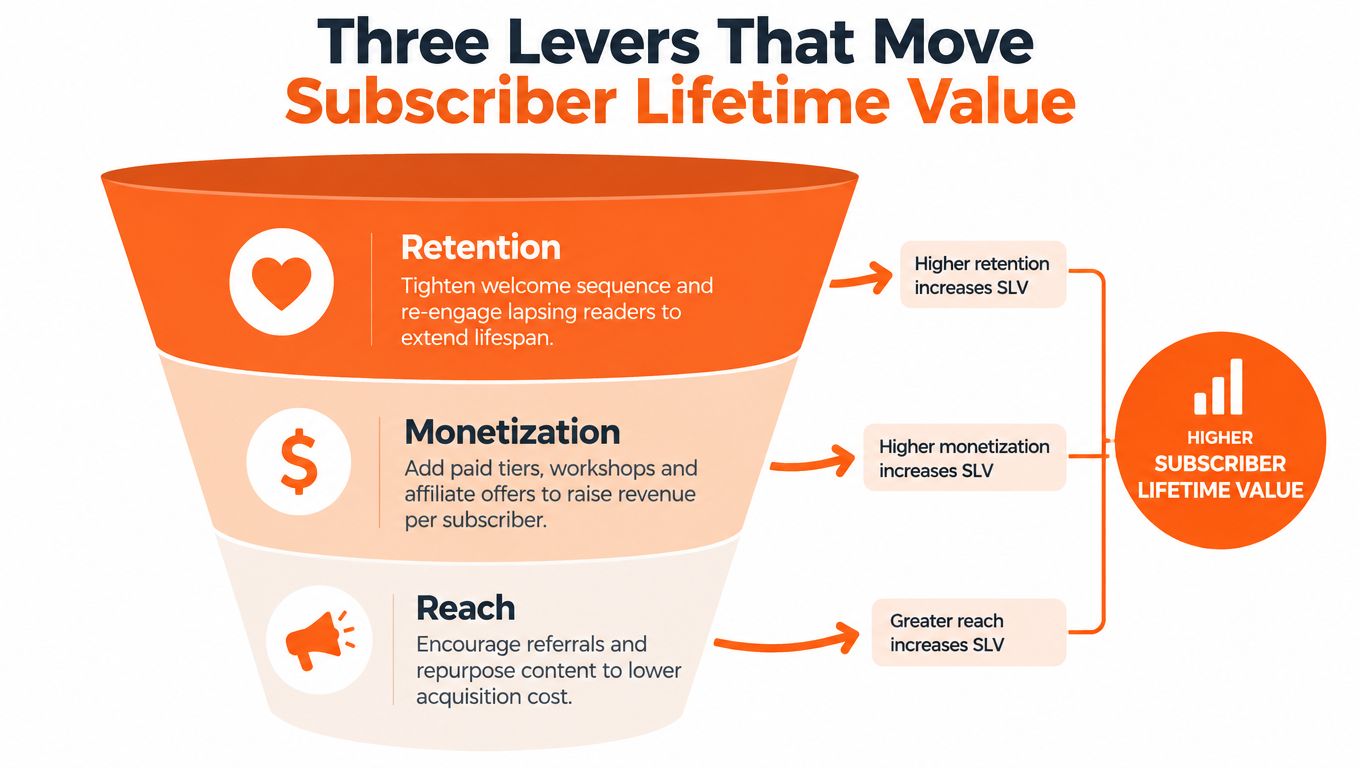
Every SLV improvement comes from changing one of three variables: retention, monetization, or reach. Reach doesn't increase the value of an existing subscriber by itself, but it can lower acquisition cost and bring in more people who enter the same retention and revenue system.
Retention extends the lifespan
Start with the first experience. Tighten the welcome sequence so a new reader quickly understands what they'll receive, how often it arrives, and where to find the strongest work. For a new project, personally reply to the first 100 subscribers. The point isn't scale. It's learning which promise attracted them and where confusion begins.
A quarterly reader survey can identify topics that keep people subscribed. A monthly best-of roundup gives long-time readers a reason to revisit useful work instead of treating every issue as disposable. Re-engagement emails should distinguish between a temporary lapse and a genuine loss of interest.
Retention changes the churn denominator in the formula. It usually takes less operational effort to improve the experience for existing readers than to replace every reader who leaves.
Monetization raises revenue per subscriber
Test pricing against perceived value, not against a competitor's landing page. A lower-cost tier can capture casual readers, while an annual plan may reduce payment friction and encourage a longer commitment. Add sponsor or affiliate placements only where they fit the issue. A short-term revenue lift that damages trust can reduce future SLV.
For broader monetization options, review this overview of a creator monetization platform. Keep a separate line for gross revenue, platform costs, refunds, and fulfillment so your model reflects contribution rather than an attractive top-line number.
Reach lowers acquisition friction
Repurpose one substantial newsletter issue into a LinkedIn carousel, a Medium article, an X thread, and several Substack Notes. Each version needs a clear reason to subscribe, not merely a shortened copy of the original.
Research cited in 2026 reports that companies using active content repurposing see double the engagement rates of those relying only on original content, while other 2026 reporting says 94% of marketers repurpose content and report up to 300% more reach. These findings are collected in content repurposing statistics. Treat them as directional evidence, then measure which formats produce subscribers who remain active.
Narrareach can schedule Substack Notes, Medium articles, LinkedIn posts, and X content from one dashboard, while its repurposing and cross-platform analytics connect distribution activity with subscriber movement. That makes it one possible workflow for writers who want to publish efficiently without manually copying each idea across platforms.
A practical distribution loop looks like this:
- Write once: Publish the full argument in the newsletter.
- Extract deliberately: Pull out one claim, one example, and one practical step.
- Adapt by channel: Turn each into the format readers expect on Substack, Medium, LinkedIn, or X.
- Schedule in batches: Prepare the week's Notes and posts together rather than interrupting every writing session.
- Attribute movement: Compare publishing activity with subscriber sources, retention, and upgrades.
Mistakes That Quietly Break Your Numbers
A spreadsheet can produce a precise answer that is still wrong. Most bad SLV models fail because the inputs describe different populations or time periods.
Five common traps
| Mistake | What It Does to Your SLV | One-Line Fix |
|---|---|---|
| Using a short churn window | Overstates retention when recent cancellations haven't appeared | Use a longer observation window and compare cohorts |
| Blending gross and net revenue | Inflates value by ignoring fees, refunds, and processing costs | Calculate contribution after attributable costs |
| Double-counting subscribers | Makes one reader appear to create multiple independent values | Assign one subscriber ID and separate revenue events |
| Mixing free and paid cohorts | Hides the economics of each business model | Report free, paid, and upgrade cohorts separately |
| Assuming linear churn | Overstates future retention by treating losses as constant headcount | Model recurring churn through a lifespan proxy or cohort decay |
The short-window error is especially common after a launch. New subscribers may look healthy because they haven't had enough time to reveal their cancellation behavior. A cohort view gives you a more honest picture than a single dashboard snapshot.
Gross revenue creates a second distortion. A $7 payment isn't equivalent to $7 of contribution if the platform, payment processor, refund rate, or service workload absorbs part of it. Put those deductions in the model before setting a CAC ceiling.
The useful number is not the most exact number. It's the number calculated consistently enough to improve a decision.
Don't combine free and paid readers just because they share an email database. Their revenue paths, churn triggers, and engagement expectations differ. Also avoid counting a paid upgrade as a new subscriber unless your model clearly separates acquisition from expansion.
For a more reliable comparison of platform data, use Substack analytics beyond native reporting. SLV should be directionally honest, transparent about assumptions, and revised as better cohort data arrives.
Your 30-Day Subscriber Lifetime Value Plan
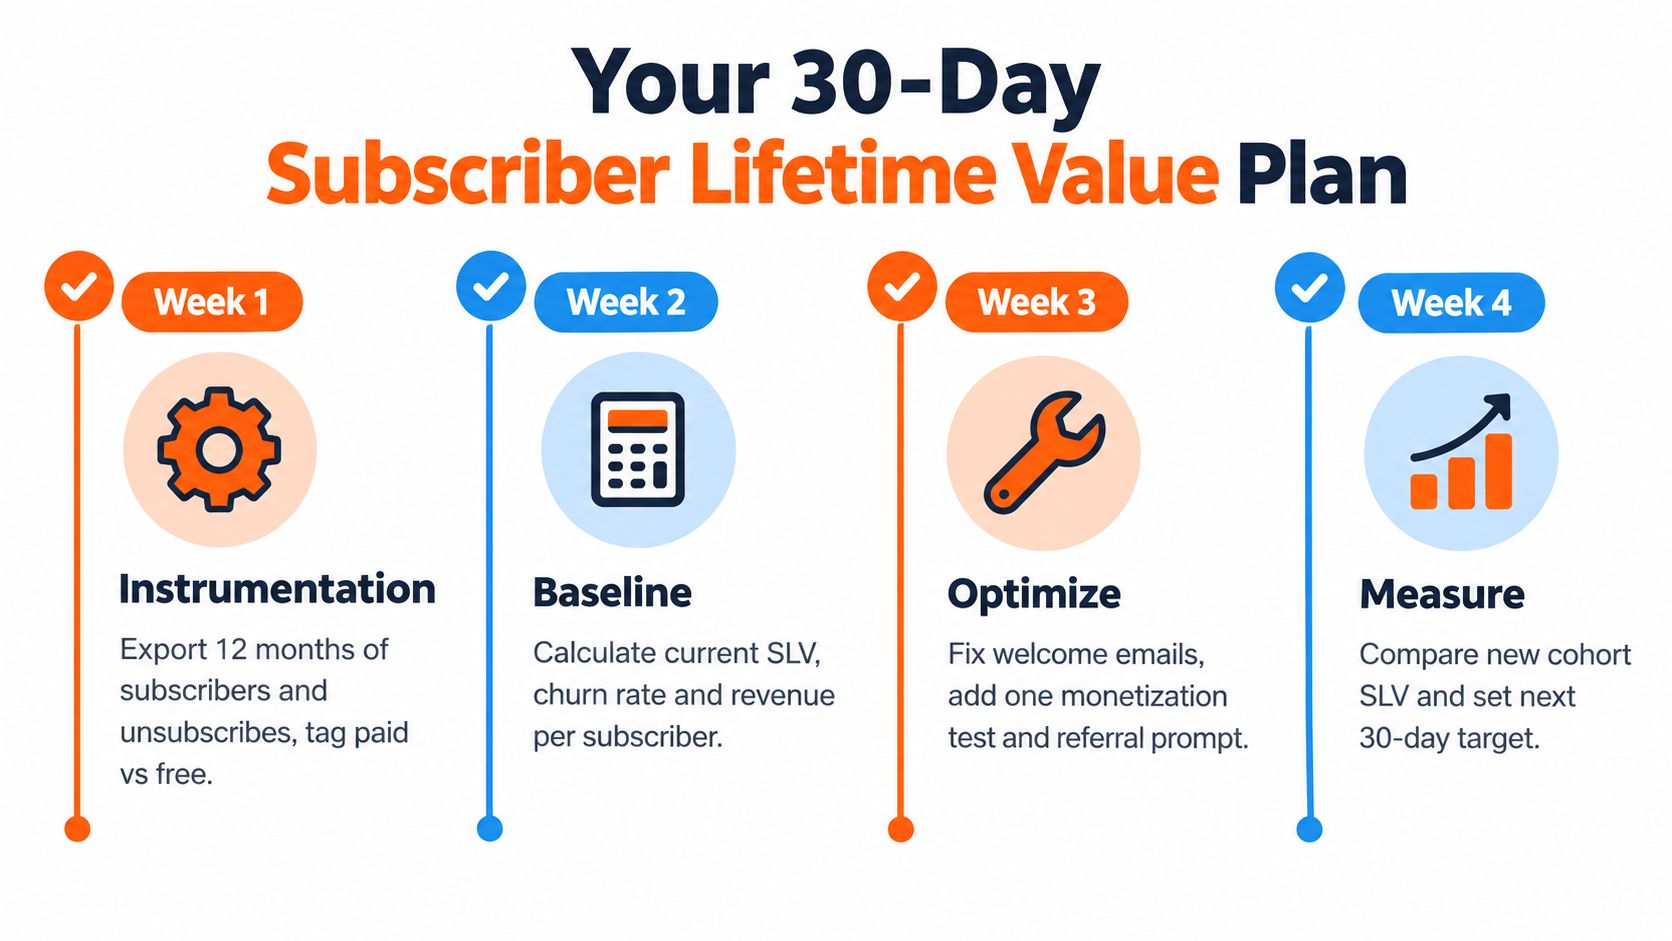
You can turn the metric into an operating habit without rebuilding your stack. Give each week one job, record the baseline before making changes, and resist the urge to run several untracked experiments at once.
Week one, instrument the list
Export the last 12 months of subscribers and unsubscribes. Tag each record as free or paid, add signup source where available, and create columns for signup date, active status, revenue, churn date, and cohort month.
Your first spreadsheet doesn't need a complex dashboard. It needs consistent definitions for active subscriber, churn, monthly revenue, RPS, and lifespan. If those definitions change every month, the trend won't mean much.
Week two, establish the baseline
Use the formulas from earlier:
- RPS: Period revenue ÷ active subscribers
- Lifespan: 1 ÷ monthly churn
- SLV: RPS × lifespan
- Paid-tier estimate: ARPA × gross margin ÷ churn
Compare the result with the relevant benchmark evidence, but don't force your list into a category that doesn't fit. Write down the gap in dollars and identify whether retention, monetization, or acquisition cost explains most of it.
Week three, ship two changes
Choose one retention move and one monetization move. For example, rewrite the welcome sequence and test an annual plan, or launch a re-engagement email while adding a carefully matched affiliate placement.
Keep the changes small enough to attribute. Schedule your supporting distribution in advance, then repurpose the newsletter into Substack Notes, Medium, LinkedIn, and X posts so the experiment doesn't consume your writing time. Track which posts produce subscribers and whether those subscribers remain active.
Week four, measure and decide
Re-run the calculation on the same cohort basis. Don't compare a mature cohort with a brand-new signup spike and call the difference a result. Record what changed, decide which experiment deserves another month, and commit to one new test.
If you're ready to model scenarios today, download a free SLV calculator and enter your own RPS, churn, margin, and acquisition cost. If you prefer a lighter commitment, subscribe to a weekly operator note that delivers one practical newsletter growth tactic each Monday.
Use Narrareach to schedule and publish Substack Notes, Medium articles, LinkedIn posts, and X content from one dashboard, then connect distribution activity with subscriber movement. Start by repurposing your next newsletter issue into a week of channel-specific posts and use the resulting data to improve subscriber lifetime value.