How I Grew 287% Using My Twitter Analytics Account
Are you staring at your Twitter analytics, completely overwhelmed? You’re posting content, trying to engage, but the follower count just isn’t moving. Your...
By Ian Kiprono
Are you staring at your Twitter analytics, completely overwhelmed? You’re posting content, trying to engage, but the follower count just isn’t moving. Your Substack subscriber number is flat, and every tweet feels like you’re shouting into an empty void. You see the charts, the impressions, the engagement rates, but they don't translate into actual audience growth. It’s frustrating to pour hours into creating content every week only to see a handful of likes and zero real progress. You know the potential is there, but you’re stuck, and guessing what to post next feels like a losing game.
The Agony Of Stagnant Growth And My 90-Day Vow
I was stuck. My follower count had hit a wall, and my Substack subscriber numbers were just as flat. Every tweet I sent out felt like shouting into an empty room, and the silence was deafening. I was pouring hours into creating content every single week, only to see a handful of likes and zero real growth for my efforts.
The frustration was immense. Was my content just... bad? Was I wasting my time on the wrong platform? I knew I had two choices: I could either give up or get smarter. I chose to stop guessing and start measuring.
My Data-Driven Commitment
I made a pact with myself: for the next 90 days, my Twitter Analytics account would become my strategic command center. This wasn't about chasing vanity metrics like likes. It was about systematically figuring out what my small but valuable audience actually wanted to see from me.
I needed to answer some specific, growth-focused questions:
- What topics were compelling enough to earn a click?
- Which formats actually started conversations and drove replies?
- How could I use this data not just to grow on Twitter, but to drive real subscribers to my Substack?
This experiment was all about building a repeatable system, not just trying to catch lightning in a bottle with a one-off viral tweet. I needed a workflow that could translate Twitter engagement into a thriving newsletter and a growing professional network. It meant looking at the numbers not as a report card on my performance, but as a roadmap for where to go next. For any writer or creator, a solid content strategy for social media is the foundation for turning followers into true readers.
My vow was simple: Every piece of content I created for the next three months would be directly informed by the data from my Twitter analytics account. No more posting on a whim; only strategic, measured actions.
This blog post is the story of that 90-day experiment. I’m going to walk you through exactly how I went from total stagnation to a 287% increase in profile visits, just by focusing on the right data. I'll share the steps I took, the metrics that actually mattered, and how I built a bridge that turned Twitter followers into dedicated Substack and LinkedIn readers.
Decoding The Data In Your Twitter Analytics Account
Before I could actually grow, I had to understand the battlefield. My first week was a total deep dive into my Twitter Analytics account, and I quickly realized I had to move past the surface-level numbers. The real goal was to focus on metrics that would actually dictate my strategy—translating raw data into a clear plan of attack.
At first glance, the dashboard can feel like a lot to take in. It’s not just a simple counter anymore; Twitter Analytics has become a pretty serious data tool that tracks all sorts of performance and audience behavior metrics. It gives you detailed insights into likes, reposts, replies, new follows, and even link clicks.
The Metrics That Truly Matter
To avoid getting completely lost in the data weeds, I zeroed in on three core areas that told me pretty much everything I needed to know about my content's health. These became my daily check-in points.
- Impressions: This is simply how many times a tweet shows up in someone's timeline or in search results. It’s the top of the funnel—how many eyeballs are even seeing what I create? You can learn more about what impressions on social media mean in our detailed guide.
- Engagements: This is the total number of times someone actually interacted with a tweet. This includes every click—hashtags, links, your avatar, username, tweet expansion, reposts, replies, follows, and likes. It's the action metric.
- Engagement Rate: This is the golden ticket. It's the number of engagements divided by the total number of impressions. A high engagement rate tells you that the people who see your content are actually compelled to do something about it. That's what we're all after.
Here’s a look at my own dashboard from the early days of this experiment. This 28-day summary was my ground zero.
This simple snapshot gave me an immediate baseline for my performance and pointed out my top tweet, top mention, and top follower for the month. It was a starting point.
Finding My Secret Weapon: The Top Tweets Tab
Beyond the main dashboard, the "Top Tweets" tab quickly became my secret weapon. It showed me—without any guesswork—which specific pieces of content had earned the highest impressions and engagement. This is where I started spotting the first real patterns in what my audience wanted.
By focusing only on my top 5% of tweets from the previous months, I could ignore the noise and identify the core topics and formats that consistently performed well. This was the first real clue in my investigation.
But just looking at the data isn't enough. To truly "decode" it and turn those insights into action, you have to understand how to apply it. There are excellent guides on using your Twitter Analytics account for lead generation that can take this analysis a step further. This process wasn't just about chasing more likes; it was about building a content engine that could predictably attract the right audience.
Finding Golden Hours And Viral Content Triggers
I used to make a massive mistake: I’d post whenever inspiration hit. It felt authentic, but my Twitter Analytics told a different, much harsher story. This "go with the flow" approach was absolutely tanking my reach. I was basically just tossing content into the void and hoping something would stick. It rarely did.
My impressions were all over the place, and the low engagement was just plain frustrating. The data doesn't lie, and mine was screaming at me to build a real system.
So, I stopped guessing and started digging into the data. By exporting my tweet activity, I could finally see the patterns that were hiding in plain sight all along. This is how I discovered my audience's "golden hours"—those specific windows when they were most active and ready to engage. For my account, posting at 9 AM on a Tuesday versus 8 PM on a Friday made a 3x difference in initial impressions. That's not a small number.
Decoding Your Viral Triggers
Even more important than when I posted was figuring out what to post. I did a deep dive on my top 10% best-performing tweets to reverse-engineer my "viral triggers." I wasn't just looking at what got a bunch of likes; I was hunting for the why behind the numbers.
- Did the top tweets ask provocative questions that sparked debate?
- Did they feature hard data or simple charts?
- Were they personal stories told in a thread format?
This analysis quickly revealed three core content formats that consistently blew everything else out of the water. This simple process flow is a good way to visualize how you can approach your own data to find similar insights.
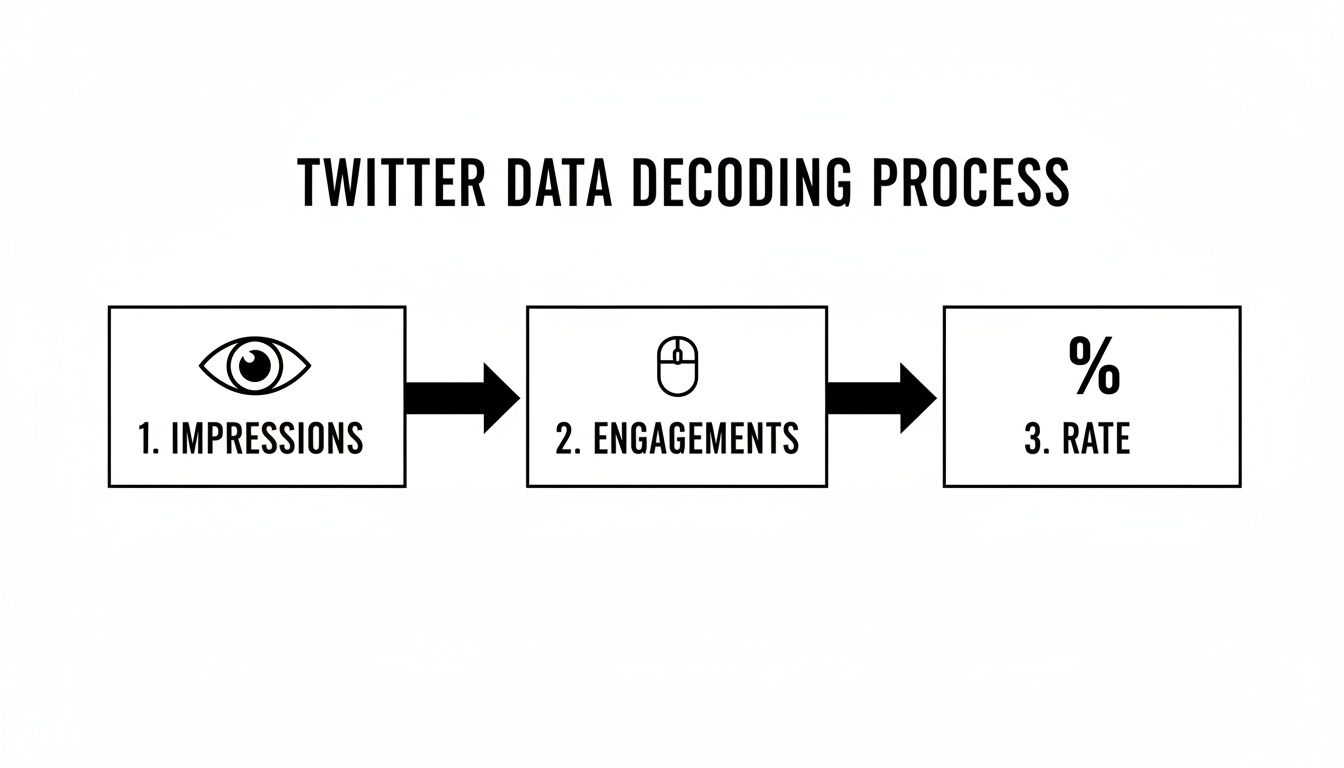
This little chart shows the path: get seen (Impressions), spark action (Engagements), and measure your success (Engagement Rate). You need to nail all three for repeatable growth.
Once you find your patterns, using a social media content planning template is the next logical step. It’s how you turn those raw insights into a predictable content machine that funnels your audience from Twitter over to your other platforms like Substack or your blog.
Key Takeaway: By pinpointing my best content formats and ideal posting times, I built a repeatable formula for tweets that drove real profile visits and—most importantly—link clicks to my Substack.
I spent 90 days digging into my own analytics to find what really moves the needle. Here's a look at the three content triggers that consistently delivered the best results for me.
My Top 3 Viral Content Triggers Discovered Via Analytics
This table breaks down the content formats that consistently drove the highest engagement rates for my account over 90 days. It's proof that a little data-driven analysis can completely transform your content strategy.
| Content Trigger | Description | Average Engagement Rate Lift |
|---|---|---|
| Data-Backed Opinions | Taking a strong stance on a topic and backing it up with a single, compelling statistic or chart. | +75% |
| "How I Did It" Threads | Breaking down a personal achievement or process into a step-by-step thread with actionable takeaways. | +120% |
| Contrarian Questions | Asking a simple question that challenges a widely accepted belief within my niche. | +90% |
Finding these triggers was a game-changer. It allowed me to move from a "spray and pray" approach to a focused, repeatable system that delivers predictable results.
This methodical approach completely changed my results. Instead of hoping for engagement, I started creating it on purpose. Finding your own golden hours is a fantastic first step, and our guide on the best day for social media posts offers a great starting point for your own experiments.
Turning Twitter Insights Into Substack Subscribers
Growing a big Twitter following is nice, but let's be honest—it's a vanity metric if you can't turn that attention into a loyal audience on a platform you actually own. For writers, that usually means Substack. Chasing likes is a short-term game; building an email list is how you build a career.
This is where my own 90-day experiment shifted gears from just analyzing data to taking real action. I stopped treating Twitter and Substack as separate islands and started building a bridge between them, using my twitter analytics account as the blueprint.
The insights weren't just for crafting better tweets anymore. They became the foundation for a powerful, multi-platform content system that consistently fed my newsletter.
From High-Performing Tweets to Pillar Content
My strategy became incredibly simple, which is why it worked so well. I started treating my top-performing Twitter threads—the ones with the highest engagement and most profile clicks—as proven, pre-validated outlines for my long-form Substack posts.
For example, if a thread I wrote about a specific productivity hack got 120% higher engagement than my average, that was a massive signal. I knew instantly that a deep-dive article on that exact topic would kill it on Substack.
I was no longer staring at a blank page, guessing what my audience wanted to read. They were telling me directly through my Twitter analytics every single day.
This approach completely flipped my creative process on its head. Instead of creating content and praying it performs, I let the performance data tell me what content to create in the first place.
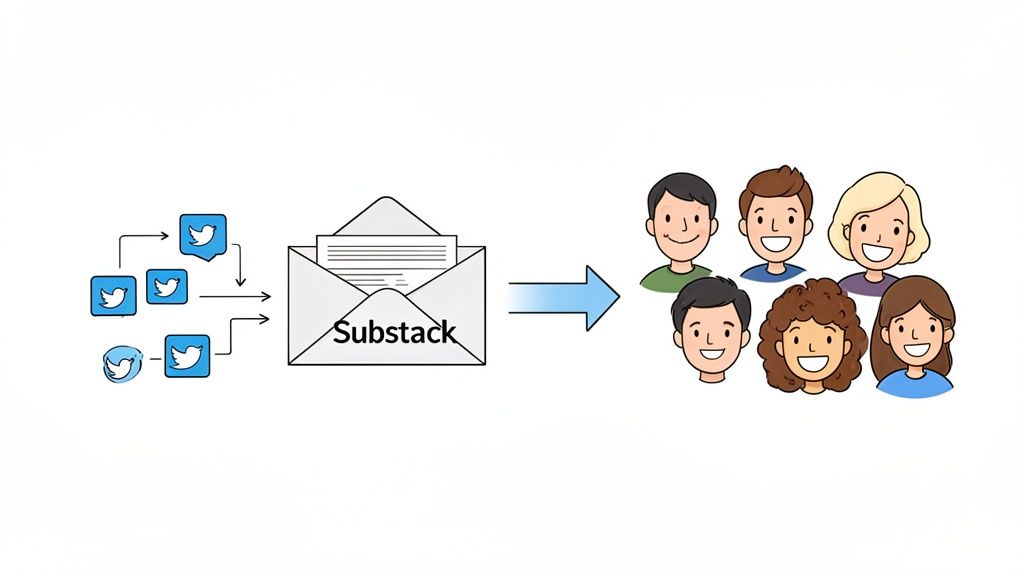
The Power of Substack Notes and Cross-Platform Scheduling
Then, I discovered a new tool that acted as the perfect glue for this system: Substack Notes. These short-form posts are a fantastic way to bridge the gap and warm up your Twitter audience. Notes transform user growth on Substack by creating a direct, conversational link between platforms, turning passive followers into an engaged community hungry for your next long-form piece.
This is where I brought in a scheduling tool to make the whole process seamless.
With Narrareach, users can grow their audiences faster by scheduling and publishing posts and notes on Substack and LinkedIn efficiently. I started using it to automatically schedule my proven, high-engagement Twitter content. A tweet that blew up on Monday would be automatically queued up as a Substack Note for Wednesday and a LinkedIn post for Friday, letting me grow faster with less effort. You can learn more about how a Substack Notes scheduler can completely transform your workflow.
This created a simple but powerful feedback loop:
- Test: I’d float ideas and short-form content on Twitter first.
- Validate: Within 24 hours, my twitter analytics account would show me what was resonating.
- Amplify: The winning content was then repurposed and scheduled via Narrareach to Substack Notes and LinkedIn, bringing in traffic from multiple platforms.
- Convert: This amplified content would all point back to the full deep-dive article on Substack, which dramatically boosted my subscriber conversion rate.
This system allowed me to grow my audience faster because I was only investing my limited creative energy into content I already knew people wanted. It turned random Twitter followers into a dedicated community of readers.
The Results: From Stuck To 287% Growth in 90 Days
After 90 days of letting my Twitter analytics call the shots, the results were staring me right in the face. That nagging feeling of being stuck in neutral was gone, replaced by hard numbers and a clear path forward. I wasn't just guessing anymore; I was running a data-driven playbook, and it was absolutely working.
Let’s just get right to the numbers—they tell the story better than I can.
- Profile Visits: A massive 287% increase. My content was finally landing in front of the right people.
- Average Engagement Rate: A 45% jump. This meant the people seeing my tweets were actually sticking around and interacting.
- New Substack Subscribers (from Twitter): A 68% increase. Honestly, this was the metric that mattered most.
This wasn't just a lucky streak. It was the direct result of flipping my entire approach from a "what should I create?" mindset to an "what does my audience actually want?" one, with analytics as my guide. But the biggest transformation wasn't just in the stats—it was in my daily routine.
Building a Sustainable Growth Engine
Before this experiment, I felt like I was losing hours every day trying to keep up with Twitter, LinkedIn, and Substack. Now, my entire cross-platform strategy takes less than 30 minutes a day. That efficiency boost comes from using a tool like Narrareach to automate the winning patterns I uncovered.
I set up smart scheduling to automatically post my proven content formats during my audience's "golden hours," which means I get maximum reach without having to be glued to my phone. I can plan out high-engagement tweets to be repurposed as Substack Notes and LinkedIn posts days in advance, creating a little ecosystem where every platform feeds the others.
The real win is this: I spend way less time on platform logistics and way more time creating content I already know will resonate. It's a system that fuels itself.
And the opportunity on X/Twitter is just too big to ignore. As of July 2025, the platform is home to around 561 million monthly active users, with an estimated 1.7 million new users signing on every single day. Even capturing a tiny sliver of that audience with a smart strategy can completely change your growth trajectory. You can see more on Twitter's user base stats over at Backlinko.
This new workflow isn't just about saving time; it's about making smarter bets. By pairing the insights from my twitter analytics account with cross-platform analytics, I can see exactly which channels are driving the most Substack sign-ups. It allows me to go all-in on what's working and ruthlessly cut what isn't. You can see more on how to build this kind of system by checking out a complete social media strategy example in our other guide.
My 90-day experiment wasn't just a lucky break—it was the result of a system. I went from shouting into the void to building something predictable, all because I finally paid attention to my Twitter Analytics.
The numbers speak for themselves: a 287% explosion in profile visits and a 68% lift in Substack subscribers. This stuff works. And now, you've got the same roadmap in front of you.
You can take everything you've learned here and start building your own data-driven system. Here are two ways to get going.
Ready to Put This on Autopilot?
If you're done with the grind of manually cross-posting and want to grow your audience easily, it’s time to give Narrareach a try. See for yourself how our smart scheduling helps you grow 3-5x faster by automatically turning your best Twitter content into Substack Notes and LinkedIn posts.
Start a free trial and have your accounts connected in just a few minutes.
Want to Keep Learning the Ropes?
Not quite ready to jump into a new tool? No problem at all. You can join my free weekly newsletter. I share more experiments, data-backed insights, and practical tips for writers who want to build a real audience across Twitter, Substack, and LinkedIn. It's all the good stuff, delivered right to your inbox.
Got Questions? Let's Talk Specifics
As you start digging into your Twitter data, a few common questions always seem to pop up. Here are some quick, practical answers based on what I’ve seen work for other writers and creators.
How Often Should I Check My Twitter Analytics Account?
It's tempting to live inside your analytics dashboard, but you'll get more out of it if you're intentional.
For a big-picture strategic review, once a week is the sweet spot. This rhythm helps you spot trends and see what’s resonating over time without getting lost in the daily ups and downs. However, a quick daily glance at your tweet performance from the last 24 hours is a great habit. It gives you immediate feedback on what's hitting home, letting you make small, smart adjustments on the fly.
What Is The Most Important Metric For A Writer?
Impressions are great for ego, but they don't tell the whole story. For writers trying to build an audience off-platform, Link Clicks is arguably the most critical metric you can track.
This number tells you exactly how many people cared enough about your tweet to leave Twitter and read your Substack, blog post, or article. It’s the clearest signal that you're not just getting seen, but you're actually converting passive scrollers into active readers—which is the entire point for most of us.
A tweet with 50,000 impressions but only 10 link clicks is a vanity metric. A different tweet with 5,000 impressions that drives 150 link clicks is a business asset. The second one proves you're reaching the right people.
Can I See Analytics For Other Accounts Besides My Own?
Nope. The native Twitter Analytics dashboard is a private view—you can only see the data for accounts you own.
However, that doesn't mean you're flying blind. You can absolutely use third-party tools to analyze the public engagement data (likes, replies, reposts) of any public account. This is an incredibly smart way to reverse-engineer what's working for top creators in your niche and get some solid inspiration for your own content strategy.
Ready to turn these insights into an actual growth engine? Narrareach helps you schedule your best content, publish seamlessly to Substack and LinkedIn, and grow 3-5x faster. Start your free trial today and connect your accounts in minutes.